Positive data on the US labor market was published yesterday.
ADP Non-Farm Employment Change was above the projected level (+7%), and its previous performance value as well (+2%). The index is based on the anonymous data study of about 400,000 American business clients. Employment is the main factor which influences the consumer demand in the United States, and so when the indicator growth is rising above the expected level, it will certainly cause the US dollar consolidation, which was observed last night. At the same time, the gold futures updated its low. It should be noted that the US stock market is still in the recovery stage, and investors tend to turn down defensive assets in favour of risky operations.
However, the fretted markets are concerned about the European geopolitical uncertainty. A possibility of imposing new sanctions against Russia and Minsk agreements violation may trigger tension again in the eastern Ukraine. If that happens, the demand for defensive assets such as precious metals may start to rise and the XAU/USD price fall would slow down.

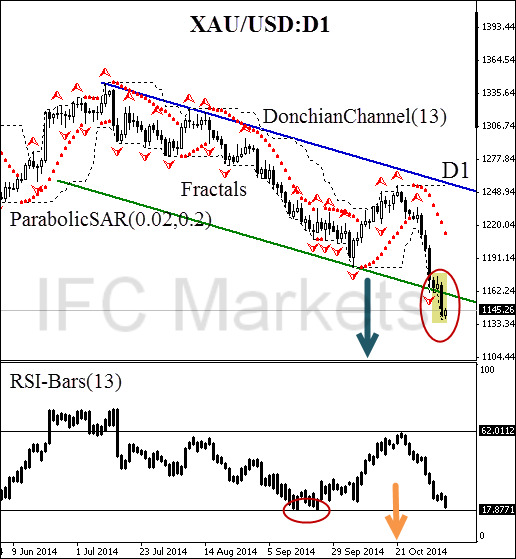
Here we consider the daily price chart of the
XAUUSD (Gold) futures. There was a breakout of the daily support line as the US positive data was released yesterday. However, the bearish paired candlestick pattern “absorption” was formed (marked in yellow), following right after the single pattern “shooting star”. The candlestick signals confirm the bearish market. Parabolic also continued the downtrend movement, and also we expect a prompt DonchianChannel reversal in the direction of the red zone. Currently, the price is moving along the lower channel border. You should pay special attention to the
RSI-Bars oscillator signal. The last bar is located near the support line confirmed by the graphic model “double bottom” on the oscillator chart. For a confident sell position opening, we should wait for the level breakout at 17.8771%. In our opinion, it will happen when DonchianChannel(13) low is updated.

Note that the volumes of
gold futures traded on the Chicago Mercantile Exchange confirm the current trend. Another high was being updated yesterday. Now it is located above the level of 375000 contracts. We suppose the further trend continuation would not allow the volume to fall below 187 000. You can monitor the trading volume by clicking
here .
Considering all the confirmatory signals, a sell position can be opened at the current price mark. Stop Loss is to be placed above 1248.94. This mark is confirmed by the bearish trend line, and it is located above the Parabolic historical values. After position opening, Stop Loss is to be moved after the Parabolic values, near the next fractal high. Thus, we are changing the probable profit/loss ratio to the breakeven point.
Position Sell
Sell current price
Stop loss above 1248.94
Dear traders. You can see the detailed report of the author’s account by clicking
here .