1. IntroductionThey say that historical data remains the only unbiased way to predict the future. It's all we've got. But is the past really a good indicator of the future? Can financial markets be modeled by quants and forecasted like weather forecasting? This article will point an accusing finger at technical analysis.
 2. Why Should We Suspect Technical Analysis
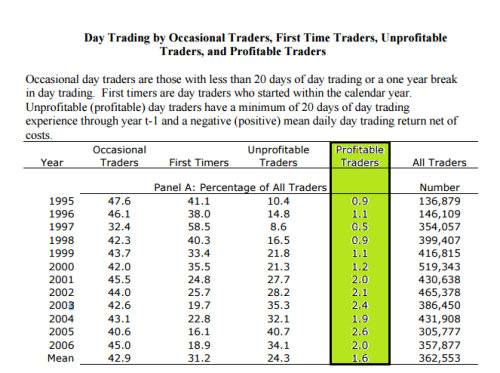
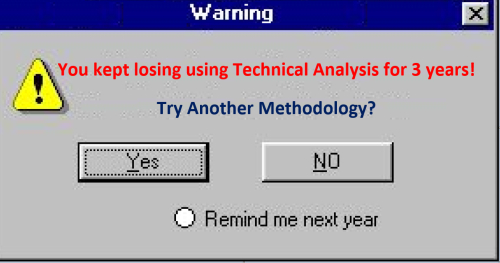
Technical analysis attracts all retail traders. It is their easy shortcut to becoming millionaires. Adopting technical analysis allows one to dispense with any other auxiliary understanding like fundamentals or market psychology because price already discounts (reflects) all information whether known to the trader or unknown. Unfortunately this prevailing and conventional practice conforms only to the conventional result of retail traders. An infamous study showed that less than 2% of traders were profitable net of all fees. In fact: 40% of day traders quit within a month, 87% of traders quit within 3 years, 93% of traders quit within 5 years.You can read the full study here .Discipline and risk management only slow down the loss and prolong the survival duration.
Forex forums are another proof of technical analysis fallacy. For years and years, traders tried to find their Holy Grail or at least a profitable and consistent strategy. All types of trend, momentum, volatility, and volume indicators are constantly created. All combinations of indicators are tested not to mention patterns and price action. It is very mysterious and pathetic how they just keep trying thousands after thousands of setups without using their inductive reasoning ability, without stopping and doubting the whole methodology.
Have you find a profitable and consistent trading program? Those expert advisors or automated strategies are another proof of technical analysis fallacy. Even the most popular trading systems in forums, and the brilliant setups in articles turn to be losers when coded and tested. Some new commercial applications use genetic algorithm testing the endless Combinations and Permutations of indicators for a profitable strategies. I tried them myself. They find astonishing back test results but with poor forward test results.Neural network software may have better results, but these are black box formulas different from traditional technical analysis.
3. Technical Analysis Intrinsic Ability to Forecast MarketsWe will examine technical analysis core assumptions and see if there is a sound basis that provides it with any forecasting ability.Actually technical analysis has three well-known assumptions:
1. The Market Discounts Everything: As discussed earlier, this is what attracts, and ruins, retail traders. The price here is never overvalued or devalued as it already reflects all factors that affect or could affect the value of the instrument. But wait a minute, even if this assumption is true, it doesn't necessarily mean that new future factors that will affect future price could be predicted using past factors that affected the price in the past. The efficient market hypothesis, which will be presented later, holds the same assumption, that price movement discounts everything. Nevertheless, it implies that technical analysis techniques will not be able to reliably produce profits in any market form. To cut this short, even if price discounts everything, that doesn't give technical analysis any forecasting ability.
2. Price Moves in Trends: This means that after a trend has been established, the future price movement is more likely to be in the same direction as the trend than to be against it. But how can we benefit from this? Well the traditional knowledge dictates that you should use some lagging indicator to identify the trend, and enter after a retracement. But how the hell will we know the answer of the million dollar question: is it a reversal or retracement? Maybe we can expect the retracement level by using the Fibonacci magical numbers which govern the fate of the universe and control everything in the world, from the formation of galaxies to the horns of goats to the behavior pattern of humans. It doesn't work? Try adding another leading indicator or add some filter, a momentum or volatility indicator, try another indicators with impressive back stories named after their authors, try the confluence of signals, try different settings, search the forums, etc. Welcome to the losers club. By the way an oft-quoted statistic tells that markets only trend 30% of the Time. So this second assumption remains an assumption, not a fact, and is very questionable.
3. History Tends To Repeat Itself: It means that price movements and patterns often repeat themselves because participants repeat their reactions, because they have the same human psychology. My problem with this assumption is that at every moment of price movement, if price goes up it will form a formation ,if it goes down it will form another formation and if it moves sideways it will form a third formation. For example: At any support or resistance if price bounces off the level it will form a reversal formation, if it penetrates the level it is will form a continuation or breakthrough formation, even after a breakthrough, price may return which will form a fake breakthrough. Thus technical analysis is just enumerating and giving names to every possible move and to every possible formation, so they must be repeated! Like the dice, it has 6 sides: 1, 2, 3, 4, 5, and 6. They will be repeated and repeated because these are all possible rolls. But does that give us any edge? Does that give us any forecasting ability? There are 47 chart patterns enumerated in "Encyclopedia of Chart Patterns" by Thomas N. Bulkowski, and the same author illustrated 105 candlestick patterns in his book "Encyclopedia of Candlestick Charts". I challenge everyone to create any new possible formation or pattern not already named in technical analysis.To sum up this point: All possible reversal or continuation patterns are enumerated and whatever move the market do, whether up, down or sideways, it is forming a well-known formation. Patterns surely repeats, and history surely repeats himself, but that will not give us any forecasting ability.
4. Technical Analysis Formations and Their Psychological SignificanceSomeone may argue that past formations at least carry a psychological indication and significance. They are the result of greed, fear, hope, information, expectations...etc. So, I invite you to examine the following chart:
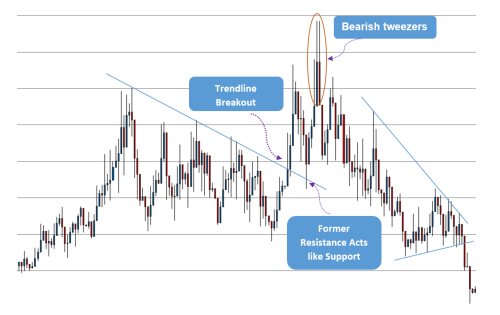
Do you see how price rallied after breaking the trend line and how it retested it again? Do you see the bearish tweezers which signals trend reversal and themselves as a part of a head and shoulder formation? You may be seeing even other formations that I don't see. That is wonderful. Now it gives me a pleasure to tell you that this chart is generated randomly by a special excel sheet tool called "Coin Tosses and Stock Price Charts". You can generate a new chart just by pressing a button there.
You can download the original tool from this page or you can download another version updated by other coders and me from here.
I just want to say that even randomness creates formations and it is hard to say that those formations have any psychological indication or have a forecasting significance.
5. ConclusionThe mass of retail traders take the easy path and depend blindly on technical analysis. They put faith in it as if is a proven fact or science. Scam artists and salesmen sell nonsense books, trading systems, newsletters and ‘mentoring’. Everyone in the industry is making profits except retail traders who never use critical thinking to learn the ever repeated lesson. In the second part of the article there will be less personal thoughts, I will present theories that deny or disregard technical analysis and their views of how can profits be made. The answer will not be as easy as "forsake technical analysis and adopt the fundamentals" so stay tuned!
With my sincere greetings and best wishes.
