LandOfCash Forex expert advisors, Trailing EA, Indicators.

Forex Trading Expert Advisors (EA or automated trading system) and Custom Indicators (CI) for MetaTrader Platform.

LOCTrailing With Partial Close Expert Advisor protect your orders profit. Trail stop level for manual and automatic orders with different algorithms, move stop loss into breakeven.

LOCInfo Custom Indicator follow the simple rules and make the right decision when to buy or sell. View Moving Average, Stochastic indicators from multiple time frames in one place.

IFC Markets
  • Posts: 85
  • Joined: 27/10/2014
Here we would represent our Technical Analysis. We hope that our information will help you)
IFC Markets
  • Posts: 85
  • Joined: 27/10/2014
The main fundamental event for today is the German Ifo Business Climate release at 10:00 CET. The composite index is based on a survey conducted among manufacturers, construction companies, as well as wholesalers and retailers, calculated by German Institute for economic research Ifo. Each month a survey is run among 7000 business representatives regarding the favorable business climate and market expectations for the next six months. Note that the index is interconnected with the main macroeconomic indicators of the EU. Rapid reaction to changing business climate provides leading signals relative to possible changes of spending costs, investment funds and attracting manpower in Germany.
The index includes 2 indicators: assessment of the current economy state and evaluation of expectations. The second component has a greater importance for investors. The German economy remains the main driver for the European markets development: more than 20% of the EU GDP. This is the biggest rate among other European member states. For this reason, we expect the Ifo index to affect greatly the European currency rate.
UserPostedImage
Here we consider the EUR/USD  currency pair on the H4 chart. The price broke the lower triangle side and was moving steadily into the red zone, until it was stopped by the primary daily trend. At the moment there is a H4 trend reversal influenced by bulls, as well as the Parabolic trend indicator: we are looking forward to the movement continuation. Note one of the most significant signals: the 30-day resistance breakout of the DonchianChannel and the trend line upward breakout of the RSI-Bars  oscillator (marked in red ellipse). Thus, all the analysis methods indicate the most probable euro uptrend continuation. As an ultimate signal, we expect the fractal high breakout at 1.27169, which may be used for opening a pending buy order. Stop Loss is recommended to be placed below 1.26304. This support level is confirmed by the strong daily trend line, and also Parabolic historical values.
After position opening, Trailing Stop is to be moved after the Parabolic values, near the next fractal low. Updating is enough to be done every day after a new Bill Williams fractal  formation (5 candlesticks). Thus, we are changing the probable profit/loss ratio to the breakeven point.

Position Buy
Buy stop above 1.27169
Stop loss below 1.26304

Dear traders. You can see the detailed report of the author’s account by clicking here .
IFC Markets
  • Posts: 85
  • Joined: 27/10/2014
Markets are frozen in the situation of uncertainty: minutes of Federal Open Market Committee are expected to be announced today, which will define the near future of the monetary policy. The Fed is assumed to be ready to complete the QE program: the economy recovery is being maintained, the labor market is quite stable. However, it is possible that the measures may be temporarily put off, due to highly volatile financial markets. If the basic expectations would still be justified, we should expect the immediate US currency strengthening and the fallen prices on precious metals futures. The latter is more likely to happen also due to the recovery continuation in the US stock market, and investors tend to give up on defensive assets in favor of risky investment.
UserPostedImage
Here we consider the XAUUSD (Gold) futures on the H4 price chart. The retracement of the daily bearish trend has been over, and an unstable downtrend is being formed now. It is confirmed by the Donchian Channel (13). The situation is still uncertain: we can see the upward breakout of the H4 trend line, and the price has prepared to move sideways. Nevertheless, due to the general price direction of the market, there is a high probability of this breakout to be false, so the price would cross down the trend line. Thus, when crossing the fractal support level at $1221.42 per ounce, we expect the Parabolic reversal moving in the direction of the red zone. This mark can be used for placing a pending sell order. It is recommended to wait for the confirmatory RSI-Bars level breakout at 27.3536%, which was confirmed three times (!) by the oscillator signal. We expect it to happen at the same time or before the bearish price movement below 1221.42. Stop Loss is better to be placed at the strong fractal resistance level at 1233.88, which is confirmed by Parabolic historical values and the Donchian Channel top boundary.

After position opening, Trailing Stop is to be moved after the Parabolic values, near the next fractal high. Thus, we are changing the probable profit/loss ratio to the breakeven point.

Position Sell
Sell stop below 1221.42
Stop loss above 1233.88
IFC Markets
  • Posts: 85
  • Joined: 27/10/2014
Here we consider the USD/JPY currency pair on the daily chart. The price is influenced by the daily uptrend, and after a slight retracement, we have all the more reason to believe in the bullish victory. The current price direction is confirmed by Parabolic historical values. There is no contradiction on the part of RSI-Bars oscillator: its values are moving upwards within the bullish trend. We can wait for an additional confirmatory signal from DonchianChannel after the breakout of the last fractal price level at 108.353. It will be preceded by the last high crossing at 58.5870% on the oscillator chart. It is recommended to use the level at 110.064 for placing a pending buy order. It is confirmed by the intersection with D1 and MN resistance lines and the Bill Williams fractal. When the price would cross the monthly resistance line, a strong bullish momentum is expected. Stop Loss is better to be placed at 105.163, which is strengthened by the intersection with the daily trend line, fractal and Parabolic historical values.
UserPostedImage
After position opening, Trailing Stop is to be moved after the Parabolic values, near the next fractal low. Updating is enough to be done every day after a new Bill Williams fractal  formation (5 candlesticks). Thus, we are changing the probable profit/loss ratio to the breakeven point.

Position Buy
Buy stop above 110.064
Stop loss below 105.163

Dear traders. You can see the detailed report of the author’s account by clicking here .
IFC Markets
  • Posts: 85
  • Joined: 27/10/2014
Yesterday the Federal Open Market Committee (FOMC) minutes revealed the statement confirming the QE3 completion in late October. This decision will result in a steady volume reduction of long-term government bonds purchases. Note that the US Q2 GDP rose 4.6% YoY. Besides, it is planned to keep interest rates at 0-0.25% per annum to maintain economic development with the help of available commercial loans. The main determinants of monetary policy remain to be unemployment and inflation rates. As it was pointed out in the statement, the base rate may be revised only in case the rate exceeds the threshold of 2%. The FOMC statement caused a significant dollar consolidation against the most liquid currencies.
Today we expect the quarterly US GDP release and Unemployment Claims. If the indicator values are at the expected level, we should wait for the general trend to be continued. A relatively modest reaction is observed only by the Canadian dollar. It is explained by the slow recovery in oil prices, which are now traded at $81 per barrel (WTI). Taking the oil component of Canadian exports into account, this fact provides confidence for investors regarding the Canadian currency. However, it is still too early to talk about a steady trend, so if the US figures are confirmed, we would expect the highs of the USDCAD  to be updated.
UserPostedImage
Here we consider the given currency pair on the H4 chart. The price has formed a triangle, indicating a temporary weakening of the current trend and establishing a steady market state. At the moment we can see the trend line breakout in the direction of the green zone, which is accompanied by the Parabolic reversal. It should be emphasized that the price breakout is not confirmed by the RSI-Bars  signal, and that means we would better wait for the resistance breach at 52.8089%, so that we would be confident in the growth continuation. As it is supposed, it will happen after the key price level crossing at 1.12589, which coincides with the Donchian Channel (13) high. This mark can be used for placing a pending buy order with Stop Loss to be placed below 1.11168. The given level is good for conservative trading, as it is strengthened by Parabolic historical values and DonchianChannel lower boundary.

After position opening, Trailing Stop is to be moved after the Parabolic values, near the next fractal low. Updating is enough to be done every day after a new Bill Williams fractal  formation (5 candlesticks). Thus, we are changing the probable profit/loss ratio to the breakeven point.

Position Buy
Buy stop above 1.12589
Stop loss below 1.11168

Dear traders. You can see the detailed report of the author’s account by clicking here .
IFC Markets
  • Posts: 85
  • Joined: 27/10/2014
Today we consider the currency index &VSUSD_Index, composed by the Personal Composite Instruments - PCI  technology. The index is designed to show the US dollar price movement against other segment of the Forex market. Acting as a systematic indicator of the FX market, we use a portfolio of the most liquid currencies: EUR(12.7%)+JPY(14.5%)+GBP(17.5%)+CHF(19.1%)+AUD(18.1%)+CAD(18.1%). The price of each currency in the portfolio is expressed in USD. The weights are determined on the basis of the currency liquidity against the volume of international bank circulation. For more detailed information and advantages regarding the US dollar index click here .

Note that the index reaction to the fundamental events of the US economy is very obvious and stable: the index forms a stable trend channel, while it is less susceptible to the fundamental events of other currencies. Let us remind you that on Wednesday the Federal Open Market Committee (FOMC) issued the statement, confirming the QE3 completion in late October. This decision will result in a gradual volume reduction of the long-term government bonds purchases. However, the interest rates are planned to be kept at the level of 0-0.25% per annum in order to maintain the economic growth with the help of available commercial loans. The FOMC statement resulted in significant dollar consolidation against the most liquid currencies. This fact allows counting on the D1 bearish trend continuation of the &VSUSD_Index.
UserPostedImage
Here we consider the daily closing/opening price chart of the given instrument. It was composed in NetTradeX platform . We can see that the price broke the lower triangle side downwards. This is the first signal of the bearish trend continuation. At the same time we can see the downward intersection of the exponential moving average (13 days) and Parabolic reversal: all the major signals confirming the trend continuation. However, we should mention a stable momentum if the channel of the triangle is broken in the direction of the red zone, crossing the mark of 0.98540. In this case we expect the resistance level breakout of the RSI(13) oscillator at 35%. This price level can be used for placing a pending sell order. Stop Loss is recommended to be placed above the upper side of the triangle.

Position Sell
Sell stop below 0.98540
Stop loss above 1.00348

More information about the mechanism of portfolio operations is available on our website section “Quick Guide for Creating and Trading PCI” .
IFC Markets
  • Posts: 85
  • Joined: 27/10/2014
Today at 14:30 (CET) we expect the release of the American and Canadian Trade Balance. This indicator is the volume ratio of exports and imports. If the difference in volume is positive, then the trade balance is positive (surplus). A surplus (or a reduction in deficit) is a favourable factor for the national currency appreciation, and it has a significant impact on the market. A simultaneous data release by two trading partners suggests a consistent interpretation. For this reason we can expect a new volatility momentum of the USD/CAD  currency pair.
UserPostedImage
Here we consider the USD/CAD on the H4 chart. The price breached the H4 bearish trend line in the direction of the green zone. New lows and highs are located above the previous ones, and that suggests the formation of a new bullish trend. After the Parabolic historical values crossed the H4 trend line, DonchianChannel reversed upwards, so this signal confirms the market sentiment. The only alarming signal comes from RSI-Bars oscillator: the last bar broke the bullish trend line downwards. The breakout can be confirmed as false only after the oscillator level crossing at 77.6035%. We expect it to happen at the same time or before the breakout of the price level at 1.13830. This mark can be used for opening a pending buy order. Currently, the bullish candlestick pattern "absorption" is formed near that level (marked in yellow). It confirms the short-term bullish trend. Stop Loss is recommended to be placed below the fractal support level at 1.12557.

After position opening, Stop Loss is to be moved after the Parabolic values, near the next fractal low. Updating is enough to be done every day after a new Bill Williams fractal  formation (5 candlesticks). Thus, we are changing the probable profit/loss ratio to the breakeven point.

Position Buy
Buy stop above 1.13830
Stop loss below 1.12557

Dear traders. You can see the detailed report of the author’s account by clicking here .
IFC Markets
  • Posts: 85
  • Joined: 27/10/2014
Today we consider the EUR/USD currency pair  on the D1 chart. At the moment the price is moving within the D1 downtrend channel: we can observe a slight retracement in the daily trend. The descending weekly channel also confirms the bearish trend significance. We have all the confirmations of the price movement from trend indicators: Parabolic historical values are moving along the trend line, and the price touches the lower boundary of DonchianChannel. There is no contradiction on the part of RSI-Bars  oscillator: the signal left the downtrend channel area and broke the resistance line downwards (marked in red ellipse on the chart). That gives us an additional signal proving the current trend continuation. We expect the price retracement to be finished when it reaches the fractal resistance level at 1.26080. The current price mark can be used for instant execution order. Stop Loss is recommended to be placed at 1.27793, which is strengthened by the fractal peak and the intersection with the D1 trend line.
UserPostedImage
After position opening, Stop Loss  is to be moved after the Parabolic values, near the next fractal high. Updating is enough to be done every day after a new Bill Williams fractal formation (5 candlesticks). Thus, we are changing the probable profit/loss ratio to the breakeven point.

Position Sell
Sell current mark
Stop loss above 1.27793

Dear traders. You can see the detailed report of the author’s account by clicking here .
IFC Markets
  • Posts: 85
  • Joined: 27/10/2014
Positive data on the US labor market was published yesterday. ADP Non-Farm Employment Change was above the projected level (+7%), and its previous performance value as well (+2%). The index is based on the anonymous data study of about 400,000 American business clients. Employment is the main factor which influences the consumer demand in the United States, and so when the indicator growth is rising above the expected level, it will certainly cause the US dollar consolidation, which was observed last night. At the same time, the gold futures updated its low. It should be noted that the US stock market is still in the recovery stage, and investors tend to turn down defensive assets in favour of risky operations.
However, the fretted markets are concerned about the European geopolitical uncertainty. A possibility of imposing new sanctions against Russia and Minsk agreements violation may trigger tension again in the eastern Ukraine. If that happens, the demand for defensive assets such as precious metals may start to rise and the XAU/USD price fall would slow down.
UserPostedImage
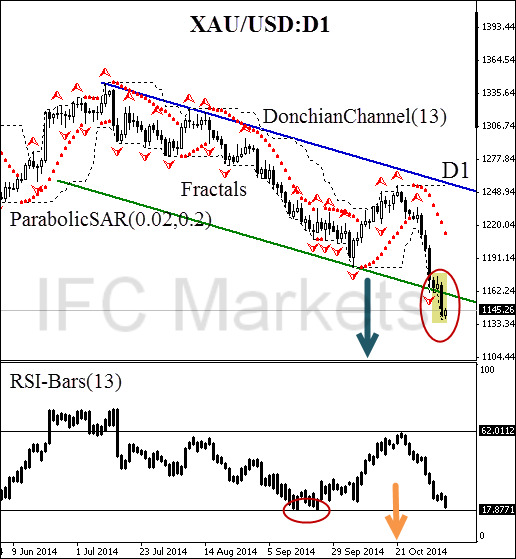
Here we consider the daily price chart of the XAUUSD (Gold)  futures. There was a breakout of the daily support line as the US positive data was released yesterday. However, the bearish paired candlestick pattern “absorption” was formed (marked in yellow), following right after the single pattern “shooting star”. The candlestick signals confirm the bearish market. Parabolic also continued the downtrend movement, and also we expect a prompt DonchianChannel reversal in the direction of the red zone. Currently, the price is moving along the lower channel border. You should pay special attention to the RSI-Bars  oscillator signal. The last bar is located near the support line confirmed by the graphic model “double bottom” on the oscillator chart. For a confident sell position opening, we should wait for the level breakout at 17.8771%. In our opinion, it will happen when DonchianChannel(13) low is updated.
UserPostedImage
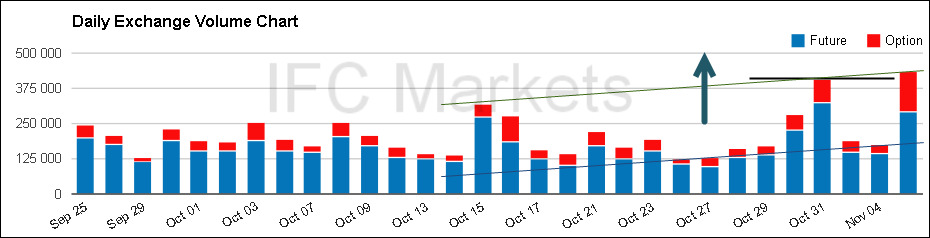
Note that the volumes of gold futures  traded on the Chicago Mercantile Exchange confirm the current trend. Another high was being updated yesterday. Now it is located above the level of 375000 contracts. We suppose the further trend continuation would not allow the volume to fall below 187 000. You can monitor the trading volume by clicking here .
Considering all the confirmatory signals, a sell position can be opened at the current price mark. Stop Loss is to be placed above 1248.94. This mark is confirmed by the bearish trend line, and it is located above the Parabolic historical values. After position opening, Stop Loss is to be moved after the Parabolic values, near the next fractal high. Thus, we are changing the probable profit/loss ratio to the breakeven point.

Position Sell
Sell current price
Stop loss above 1248.94

Dear traders. You can see the detailed report of the author’s account by clicking here .
IFC Markets
  • Posts: 85
  • Joined: 27/10/2014
Today we do not expect the release of significant fundamental events that may affect the price movement of the most liquid instruments of the Forex market. It means that we would focus on the psychological sideways trend of the market, which may be indentified with the help of technical analysis. The first important data will come out on Wednesday: the Bank of England Governor Mark Carney’s speech. Up until that point the most probable price movement of the GBP/USD  is in sideways market. However, it can be breached as investors expect the US dollar to strengthen further.
UserPostedImage
Here we consider the GBP/USD on the H4 chart. The price is moving within the D1 and H4 trend: the bearish trends coincide. Currently, a retracement can be observed: it will be finished after the fractal support breakout at 1.57789. It will happen when Parabolic historical values cross the price, so that the trend indicator would reverse in the direction of the red zone. The significance of the support level is also confirmed by the lower boundary of Donchian Channel. The most alarming signal was received from RSI-Bars : the upward breakout of the trend line. Conservative traders are recommended to wait for the oscillator signal return into the trend channel area. Stop Loss is better to be placed above 1.60252. This mark is confirmed by the upper boundary of Donchian Channel and Bill Williams fractal.
After position opening, Stop Loss is to be moved after the Parabolic values, near the next fractal high. Updating is enough to be done every day after a new Bill Williams fractal  formation (5 candlesticks). Thus, we are changing the probable profit/loss ratio to the breakeven point.

Position Sell
Sell stop below 1.57789
Stop loss above 1.60252

Dear traders. You can see the detailed report of the author’s account by clicking here .
IFC Markets
  • Posts: 85
  • Joined: 27/10/2014
Today at 1:30 (CET) NAB Business Confidence index was released. It indicates the level of business optimism in Australia. This diffusion index is calculated every month by the National Australia Bank, based on a survey of more than 300 companies. The indicator allows estimating the investment climate improvement in the country, consumer spending and unemployment rate. This month the Business Confidence index has fallen 4 points vs. 5 points last month. Consequently, AUD/USD  price dynamics was immediately affected. We may expect a further depreciation as the US dollar strengthens after the QE completion.
UserPostedImage
Here we consider the AUD/USD currency pair on the H4 chart. The price is moving within the D1 and H4 trends: the bearish trends coincide. At the moment we can witness a new trend formation, which will be intensified after the breakout of the fractal support at 0.85317. In the short-run, the current trend is confirmed by the candlestick pattern "absorption" (marked in yellow on the chart). We can also see there has already been the intersection of the Parabolic historical values and the trend indicator reversal in the direction of the red zone. The support level significance is also confirmed by the lower boundary of DonchianChannel. RSI-Bars  oscillator verifies the current trend, but the final confirmatory signal is expected after the level breach at 39.7701%. In our opinion, it will happen when the price crosses the mark at 0.85317, which can be used for placing a pending sell order. Stop Loss is recommended to be placed above 0.86873. This mark is strengthened by the upper boundary of DonchianChannel, Bill Williams fractal and Parabolic historical values.
After position opening, Stop Loss is to be moved after the Parabolic values, near the next fractal high. Updating is enough to be done every day after a new Bill Williams fractal  formation (5 candlesticks). Thus, we are changing the probable profit/loss ratio to the breakeven point.

Position Sell
Sell stop below 0.85317
Stop loss above 0.86873

Dear traders. You can see the detailed report of the author’s account by clicking here .
IFC Markets
  • Posts: 85
  • Joined: 27/10/2014
At 11:30 (CET) the Bank of England Governor Mark Carney will be giving his speech today. He will be discussing the BOE quarterly Inflation Report. The report is focused on inflation expectations and the actual economy state. An excessive currency expansion may cause changes in the regulator’s monetary policy, e.g. the base interest rate hike. On the contrary, a deflation risk triggers the monetary policy easing. Therefore, today we expect a possible volatility momentum of the British currency, after the situation over the last quarter becomes clear.
UserPostedImage
Here we consider the GBP/USD  currency pair on the H4 chart. The price keeps moving in the daily bearish trend, but at the same time we can see the H4 trend line breakout in the direction of the green zone. The signal is strengthened with the neckline intersection of the bearish graphic model “head and shoulders”. We could have considered this position as an opportunity for opening a buy order, if we are not taking the D1 trend line proximity into account. It limits the potential motion compared to the possible risks. For this reason we can turn to the reflecting pattern called "Hound of the Baskervilles", which will be formed if the price breaks the support level at 1.57951. This level can be used for placing a pending sell order. It is confirmed by Parabolic historical values, Bill Williams fractal and the lower boundary of DonchianChannel. There is a high probability that this mark intersection would cause a strong bearish momentum. Currently, the price gives the first signs of a downward uncertain movement. You should pay attention to the "shooting star" candlestick pattern (marked in yellow on the chart). Besides, the formation of a new low of the RSI-Bars  oscillator signal confirms the future price reversal. Conservative traders are recommended to wait for the oscillator support level breakout at 32.9498%, which will precede the main price down movement.
The preliminary Stop Loss can be placed above 1.59522. This level is confirmed by the fractal and the upper boundary of DonchianChannel (13). After position opening, Stop Loss is to be moved after the Parabolic values, near the next fractal high. Updating is enough to be done every day after a new Bill Williams fractal  formation (5 candlesticks). Thus, we are changing the probable profit/loss ratio to the breakeven point.

Position Sell
Sell stop below 1.57951
Stop loss above 1.59522

Dear traders. You can see the detailed report of the author’s account by clicking here .
IFC Markets
  • Posts: 85
  • Joined: 27/10/2014
Here we consider the XAUUSD (Gold)  futures contract on the H4 price chart. The price was moving in the daily retracement before an unsteady balance of bears and bulls was formed (see the triangle on the chart). The last candlestick breached the H4 trend line downwards. However, there was no confirmatory signal on the part of the RSI-Bars  oscillator.
UserPostedImage
The market is looking for equilibrium. In this case, two opposing orders can be opened on the basis of the resistance level at 1173.72 and the support level at 1145.30. Both marks are confirmed by the DonchianChannel boundaries, Parabolic historical values and Bill Williams fractals. After one of the orders was executed, the second one can be deleted. Let the market choose the price direction.

After position opening, Stop Loss is to be moved after the ParabolicSAR values, near the next fractal high (short position) or fractal low (long position). Thus, we are changing the probable profit/loss ratio to the breakeven point.

Position Sell
Sell stop below 1145.30
Stop loss above 1173.72

Position Buy
Buy stop above 1173.72
Stop loss below 1145.30

Dear traders. You can see the detailed report of the author’s account by clicking here .
IFC Markets
  • Posts: 85
  • Joined: 27/10/2014
Today we expect Mario Draghi to speak before the Committee on Economic and Monetary Affairs at 15:00 (CET) in Brussels. Investors are willing to listen for the ECB President’s comments regarding the low inflation rate and the EU economic slowdown. The main danger for the EU economy is still the possibility of deflation with a consequenе reduction of revenue and output profitability. Mario Draghi’s speech may affect the volatility of the most liquid currency pairs which are exposed to the EU monetary policy.
UserPostedImage
Here we consider the USD/CHF  currency pair on the H4 chart. The price is still moving in the daily uptrend, but there is a number of alarming signals of the trend fading out. First of all, they include the lower triangle side breakout, which coincides with the bearish candlestick pattern “absorption” (marked in yellow on the chart). Secondly, the price is drifting in the lower part of the price channel. Finally, RSI-Bars  oscillator signal indicates the bearish divergence and broke the lower boundary of the sideways channel at 34.9337%. The bullish backtrack is possible only after a significant market restructure. Note the necessary condition for this: the upper triangle side breakout at 0.96876. It will result in the Parabolic trend indicator reversal in the direction of the green zone, and the intersection with the upper Donchian Channel boundary. Conservative traders are also recommended to wait for the breakout of the oscillator resistance level at 57.8749%, which would erase the bearish divergence. The price level at 0.96876 can be used for opening a pending buy order with Stop Loss placed below the last fractal low at 0.94410. The proposed Stop Loss level is confirmed with the D1 trend line intersection, Parabolic historical values and also the lower Donchian Channel boundary.

After position opening, Stop Loss is to be moved after the Parabolic values, near the next fractal low. Updating is enough to be done every day after a new Bill Williams fractal  formation (5 candlesticks). Thus, we are changing the probable profit/loss ratio to the breakeven point.

Position Buy
Buy stop above 0.96876
Stop loss below 0.94410

Dear traders. For the detailed report of the strategy based on the analytical issues of technical analysis click here .
IFC Markets
  • Posts: 85
  • Joined: 27/10/2014
Today at 14:30 (CET) Producer Price monthly Index should be released at US – PPI m/m. The indicator is formed by Labor Department and displays a percentage change of prices for US goods and services. PPI m/m is a basic inflation factor and takes into account three areas of production: manufacturing, commodities production and processing industry. The indicator publication may influence a volatility of most liquid currencies. Inflation is a key factor which defines a monetary policy of Fed and a pace of transition from quantitative easing (QE) to a traditional model of regulation. An acceleration of this process and a perspective of basic rate growth will inevitably lead to the strengthening of USD against other currencies.
UserPostedImage
Let’s consider EUR/USD  instrument at H4 chart. A price is still moving inside a falling D1 and H4 trend channels. At the same time we may observe certain dangerous bullish signals. In particular, a triangle equilibrium has been broken in the direction of a green zone with simultaneous formation of bullish divergence of RSI-Bars  oscillator. One of previous bars has broken the weekly (!) resistance level which is an important signal of bear’s attenuation. We suppose that unstable market equilibrium is observed and that an upward breakdown of D1 trendline is probable. At the same time we can not exclude a correction weakening with account of basic tendency influence. We shall give the market an opportunity to make a choice. For now it should be reasonable to consider two symmetrical opposite pending orders, formed with account of two key levels: 1.25817 и 1.23932. Both levels are verified by historical values of ParabolicSAR trend indicator, boundaries of Donchian channel and Bill Williams fractals. One of proposed levels may be used for pending order opening with stop level located below or above another key level. Under condition of first order activation, another one should be removed.
After position opening, Stop Loss is to be moved after the Parabolic values, near the next fractal maximum (short position) or minimum (long position). Updating is enough to be done every day after a new Bill Williams fractal  formation (5 candlesticks). Thus, we are changing the probable profit/loss ratio to the breakeven point.

Position Buy
Buy stop above 1.25817
Stop loss below 1.23932

Position Sell
Sell stop below 1.23932
Stop loss above 1.25817

Dear traders. For the detailed report of the strategy based on the analytical issues of technical analysis click here .
IFC Markets
  • Posts: 85
  • Joined: 27/10/2014
Today at 14:30 (CET) we expect the release of Building Permits issued monthly by the US government. The indicator allows estimating the growth potential of the US real estate sector, secondary demand goods and technology sector. The increase in indicator performance is expected today, compared with the past month data (1.04 million). Should the forecast become real, investors would feel more confident, and as a result, the US dollar would strengthen against other liquid currencies, including the British pound.

UserPostedImage

Here we consider the GBP/USD  on the H4 chart. The price is still drifting downwards, while remaining in the bearish H4 channel. Parabolic trend indicator confirms the bearish bias: its historical values are moving along the upper Donchian Channel boundary, therefore intensifying its significance. There is no contradiction on the part of RSI-Bars  oscillator, which continues hitting new lows. Conservative investors should wait for a confirmatory signal: the RSI support breakout at 26.3819%. In our opinion, it would happen before or coincide with the key price level breaking at 1.55855. This mark is confirmed by Bill Williams fractal and lower boundary of Donchian Channel. Stop Loss may be placed near the fractal high at 1.57404, coinciding with the current Parabolic value.

After position opening, Stop Loss is to be moved after the Parabolic values, near the next fractal high. Updating is enough to be done every day after a new Bill Williams fractal formation (5 candlesticks). Thus, we are changing the probable profit/loss ratio to the breakeven point.

Position Sell
Sell stop below 1.55855
Stop loss above 1.57404

Dear traders. For the detailed report of the strategy based on analytical issues of technical analysis click here .
IFC Markets
  • Posts: 85
  • Joined: 27/10/2014
Today at 14:30 (CET) we expect the release of Core CPI which reflects the inflation trend of the Canadian economy. The index is published by the Statistics Canada and measures a change in the price of goods and services, excluding the 8 most volatile items. This indicator determines the inflation rate, which in turn affects the monetary policy and the interest rate established by the Bank of Canada. The Bank’s Governing Council takes the inflation expectations into account to limit the excessive pace of its growth due to the policy tightening. The rate hike leads to investment funds inflow in the country’s economy: this is the reason why CPI release may have a significant impact on the Canadian currency rate against its most liquid competitors.
UserPostedImage
Let’s consider the USD/CAD  currency pair on the H4 chart. The price is moving in the daily bullish trend. We assume that the current retracement is about to be completed. One of the graphic signals of bearish strength is the pattern called “double bottom” (marked in red on the chart). It allows choosing the critical level for placing Stop Loss at 1.12587. Moreover, this level is confirmed by Parabolic historical values and the lower boundary of Donchian Channel. We should wait for the H4 trendline breakout to get the signal confirmation for opening a buy order. This breakout is supposed to coincide with the fractal level breach at 1.13718 and Parabolic upward reversal. The significance of this mark is also verified by the upper boundary of Donchian Channel. Conservative traders should wait for the resistance crossing of the RSI-Bars  oscillator at 61.0597% to confirm the buy position opening.
After position opening, Stop Loss is to be moved after the Parabolic values, near the next fractal low. Updating is enough to be done every day after a new Bill Williams fractal formation (5 candlesticks). Thus, we are changing the probable profit/loss ratio to the breakeven point.

Position Buy
Buy stop above 1.13718
Stop loss below 1.12587

Dear traders. For the detailed report of the strategy based on analytical issues of technical analysis click here .
IFC Markets
  • Posts: 85
  • Joined: 27/10/2014
Today at 14:30 (CET) we expect the release of two economic indicators: Core retail sales, CRS in Canada and the preliminary Q3 GDP in the US. CRS is released monthly by Statistics Canada and shows a relative change in the total value of sales at the retail level, excluding automobiles, which account for 20% of the total volume. CRS is a monthly measurement of all goods sold by retailers, based on the sampling of different types of retail stores. The index defines long-term trends in consumer activity. The quarterly US GDP is also of interest primarily for long-term investors. Let us remind you that GDP expresses the cost of manufactured goods and services and adjusted for inflation. The GDP indicator shows the change in values of the previous quarter (%).In our opinion, the greatest volatility is expected today from the US currency relative to other liquid instruments.

UserPostedImage

Here we consider the USD/CAD  currency pair on the H4 chart. The price is preparing to move in the direction of the green zone, as evidenced by the Parabolic reversal. The fractal support level at 1.11835 is crossing the daily bearish trend line, which makes this mark suitable for reliable risk mitigation of a long position. A pending buy order can be placed above 1.13146, which is also confirmed by Parabolic historical values and the fractal. Conservative traders are recommended to look for the RSI-Bars  resistance level breakout at 56.1854%. This signal must confirm the opening of a pending order.


After position opening, Stop Loss is to be moved after the Parabolic values, near the next fractal low. Updating is enough to be done every day after a new Bill Williams fractal formation (5 candlesticks). Thus, we are changing the probable profit/loss ratio to the breakeven point.

Position Buy
Buy stop above 1.13146
Stop loss below 1.11835

Dear traders. For the detailed report of the strategy based on analytical issues of technical analysis click here .
IFC Markets
  • Posts: 85
  • Joined: 27/10/2014
Today at 14:30 (CET) we expect the release of two US economic indicators: Core Durable Goods Orders m/m and Unemployment Claims over the past week. The first indicator has long-term impact on the market. It is released monthly by the US Census Bureau. It does not include transportation items: orders for cars and airplanes. Change in the total value of new purchase orders placed with manufacturers for durable goods allows evaluating the outlook for production development and the attraction of long-term investment. The second indicator, Unemployment Claims, is based on the weekly data and shows the local labor market conditions. The data is published in a weekly report by the Department of Labor. The index allows estimating the domestic demand dynamics and the consumer loan potential for the US economy stimulus. In our opinion, the greatest volatility is expected today from the US currency relative to other liquid instruments.

UserPostedImage

Here we consider the USD/CHF  currency pair on the H4 chart. The price is preparing to move in the direction of the green zone, as evidenced by the Donchian Channel reversal. The fractal support level at 0.95637 is crossing the daily bullish trend line, which makes this mark suitable for reliable risk mitigation of a long position. A pending buy order can be placed above 0.97183, which is also confirmed by Parabolic historical values and the Bill Williams fractal. Conservative traders are recommended to look for the RSI-Bars  resistance level breakout at 62.9730%. This signal must confirm the opening of a pending order.

After position opening, Stop Loss is to be moved after the Parabolic values, near the next fractal low. Updating is enough to be done every day after a new Bill Williams fractal  formation (5 candlesticks). Thus, we are changing the probable profit/loss ratio to the breakeven point.

Position Buy
Buy stop above 0.97183
Stop loss below 0.95637

Dear traders. For the detailed report of the strategy based on analytical issues of technical analysis click here .
IFC Markets
  • Posts: 85
  • Joined: 27/10/2014
Let us consider the daily price chart of XAUUSD (Gold)  futures. The price is moving in the limits of W1 and D1 bearish trend, containing the falling Donchian Channel. At the moment, we can observe the price retracement completion: the last bar peak of RSI-Bars  oscillator is located on the border of the resistance trend line, and that means a prompt price reversal is about to happen. The corresponding Parabolic confirmation will be obtained after the support level breakout at 1162.82, located below next to the last Bill Williams fractal. This mark can be used for opening a pending sell order with Stop Loss placed above $1208.85 per troy ounce. This level is confirmed by the upper Donchian Channel boundary and the last resistance fractal.

UserPostedImage

Currently, we do not have a confirmatory bearish signal looking at the trading volume on Chicago Mercantile Exchange. For this reason, conservative traders are recommended to wait for the level of 375000 contracts to be outperformed: in this case, we can be sure in the trend continuation. For the trading volume data please click here .

UserPostedImage

After position opening, Stop Loss is to be moved after the ParabolicSAR values, near the next fractal high. Thus, we are changing the probable profit/loss ratio to the breakeven point.

Position Sell
Sell stop below 1162.82
Stop loss above 1208.85

Dear traders. For the detailed report of the strategy based on analytical issues of technical analysis click here .
IFC Markets
  • Posts: 85
  • Joined: 27/10/2014
Here we consider the EURUSD  currency pair on the D1 chart. The price is moving in the limits of W1 and D1 bearish downtrend, containing the falling Donchian Channel. At the moment, we can observe the price retracement completion: the last bar peak of RSI-Bars  oscillator is located on the border of the overbought zone, and that means a prompt price reversal is about to happen when the oscillator signal leaves the triangle area. Parabolic values are moving along the daily trend line, confirming the trend. Donchian Channel confirmation will be obtained after the support level breakout at 1.23505, located below last two Bill Williams fractals. This mark can be used for opening a pending sell order with Stop Loss placed above 1.26072. This level is confirmed by the upper Donchian Channel boundary and the last resistance fractal.

UserPostedImage

Currently, we do not have a confirmatory bearish signal looking at the trading volume on Chicago Mercantile Exchange. For this reason, conservative traders are recommended to wait for the level of 450000 contracts to be outperformed: in this case, we can be sure in the trend continuation. For the trading volume data please click here .

UserPostedImage

After position opening, Stop Loss is to be moved after the ParabolicSAR values, near the next fractal high. Thus, we are changing the probable profit/loss ratio to the breakeven point.

Position Sell
Sell stop below 1.23505
Stop loss above 1.26072

Dear traders. For the detailed report of the strategy based on analytical issues of technical analysis click here .
IFC Markets
  • Posts: 85
  • Joined: 27/10/2014
The fallen oil futures  prices after the OPEC meeting resulted in a significant depreciation of commodity currencies against the US dollar: it was in favour of USD and led to a significant strengthening of the dollar index. Today at 14:00 CET we expect the monthly release of ISM Manufacturing PMI in the United States. This diffusion index is based on a survey of 400 purchasing managers in the manufacturing industry, which evaluate employment, output volume, orders and stockpiles. It is the most important economic indicator as it permits obtaining preliminary information on manufacturing activity which affects the investor optimism. In our opinion, the greatest volatility is expected today from the US currency relative to other liquid instruments of the currency market.

UserPostedImage

Here we consider the GBP/USD  currency pair on the D1 chart. The price is preparing to move in the direction of the red zone, as evidenced by the Parabolic reversal. The fractal resistance level at 1.58410 is crossing the daily bearish trend line, which makes this mark suitable for reliable risk mitigation of a short position. This level is also confirmed by the upper Donchian Channel boundary. A pending sell order can be placed below 1.55784, which is confirmed by Parabolic historical values and the Bill Williams fractal. Conservative traders are recommended to look for the RSI-Bars  support level breakout at 22.6194%. This signal must confirm the opening of a pending order. We can see the volume of futures traded on Chicago Mercantile Exchange outperformed the highest level of 125000 contracts: the downtrend is likely to maintain. The trading volume confirms the birth of a new trend.

UserPostedImage

After position opening, Stop Loss is to be moved after the Parabolic values, near the next fractal high. Updating is enough to be done every day after a new Bill Williams fractal formation (5 candlesticks). Thus, we are changing the probable profit/loss ratio to the breakeven point.

Position Sell
Sell stop below 1.55784
Stop loss above 1.58410

Dear traders. For the detailed report of the strategy based on analytical issues of technical analysis click here .
IFC Markets
  • Posts: 85
  • Joined: 27/10/2014
Let us consider the daily price chart of XAUUSD(GOLD)  instrument. The price is moving in the limits of W1 and D1 bearish trend, containing the falling Donchian Channel. At the moment, we can observe the price retracement completion: the last bar peak of RSI-Bars  oscillator is located on the border of the overbought zone, and that confirms a price reversal is about to happen when the oscillator signal breaks the support level at 16.5854%. The corresponding Parabolic confirmation will be obtained after the support level breakout at 1128.95, located below next to the last Bill Williams fractal and the Donchian Channel border. This mark can be used for opening a pending sell order with Stop Loss placed above 1258.35. This level is confirmed by the upper Donchian Channel boundary and the D1 trend line.

UserPostedImage

Currently, we have a confirmatory bearish signal looking at the volume of gold futures and options traded on Chicago Mercantile Exchange. The number of contracts outperformed the last level of 375000, and it is still advancing. For the trading volume data please click here .

UserPostedImage

After position opening, Stop Loss is to be moved after the ParabolicSAR values, near the next fractal high. Thus, we are changing the probable profit/loss ratio to the breakeven point.

Position Sell
Sell stop below 1128.95
Stop loss above 1258.35

Dear traders. For the detailed report of the strategy based on analytical issues of technical analysis click here .
IFC Markets
  • Posts: 85
  • Joined: 27/10/2014
Today we expect the release of two indicators which can affect significantly the Canadian dollar volatility. In the first place, ADP Non-Farm Employment Change will be published at 14:15 CET, released monthly by Automatic Data Processing. The parameters are based on the study of anonymous data from around 400.000 US business clients, excluding the farming industry and government. The preliminary estimate of employment rate is released two days before the publication of Nonfarm. That is why this indicator is worth a closer look. Employment rate is the key factor influencing the US consumer demand. If the index falls below the expected value, it will almost certainly result in the US currency weakening. Two hours later the Bank of Canada will publish the Rate Statement and cast light upon the economic situation development. We assume that the oil market restructuring and fallen energy prices may lead to the monetary policy revision of the largest exporter in favour of easing.

Here we consider the USDCAD  currency pair on the D1 chart. The price is moving in the limits of W1 and D1 bullish trend, containing the rising Donchian Channel. Parabolic values are moving along the D1 trend line, confirming the trend direction. The final oscillator confirmation will be obtained after the local resistance level breakout at 73.2061%: this level is strengthened by “triple top” chart pattern, marked in red ellipse. In our opinion, this event will coincide with the price level intersection at 1.14735. This mark can be used for opening a pending buy order with Stop Loss placed below 1.11785. Both levels are confirmed by Donchian Channel boundaries, Parabolic historical values and Bill Williams fractals .

UserPostedImage

After position opening, Stop Loss is to be moved after the ParabolicSAR values, near the next fractal low. Thus, we are changing the probable profit/loss ratio to the breakeven point.

Position Buy
Buy stop above 1.14735
Stop loss below 1.11785

Dear traders. For the detailed report of the strategy based on analytical issues of technical analysis click here .
IFC Markets
  • Posts: 85
  • Joined: 27/10/2014
Today at 14:30 (CET) we expect the release of Building Permits in Canada. The indicator is released monthly and shows the number of permits for new construction, issued by the government. Building Permits data permits estimating the growth potential of the real estate sector and, as a result, goods of secondary demand and technology sector. The reduced index values are perceived by investors as a negative signal for domestic consumption and production. If the value is worse than expected, we can count on further growth of USDCAD  currency pair.

UserPostedImage

Here we consider this instrument on the H4 chart. The price is moving upwards within the W1, D1 and H4 price channel: bullish trend is observed for all the timeframe scales. ParabolicSAR historical values confirm the H4 trend line and cross the lower boundary of Donchian Channel. Two graphic bullish signals are received: the breakout of the triangle side on the price chart, and a similar graphic pattern on the RSI-Bars  oscillator chart. Note that RSI-Bars oscillator has justified itself as a leading indicator, because its graphic pattern was formed a few hours earlier (!).

UserPostedImage

The volume of futures traded on the Chicago Mercantile Exchange is growing: it confirms the trend on the D1 chart. For monitoring the liquidity evolution click here . A pending buy order may be placed above the resistance at 1.14789. This mark is confirmed by a Bill Williams fractal and the upper boundary of the Donchian Channel. Stop Loss is better to be placed below the support fractal at 1.13805. It is important to note that this level crosses the upper triangle side and it reinforces its significance.

After position opening, Stop Loss is to be moved after the Parabolic values, near the next fractal low. Updating is enough to be done every day after a new Bill Williams fractal formation (5 candlesticks). Thus, we are changing the probable profit/loss ratio to the breakeven point.

Position Buy
Buy stop above 1.14789
Stop loss below 1.13805

Dear traders. For the detailed report of the strategy based on analytical issues of technical analysis click here .
IFC Markets
  • Posts: 85
  • Joined: 27/10/2014
Here we consider the GBP/USD currency pair on the H4 chart. The price is moving within the limits of D1 and H4 downtrend channel: bearish trend is observed for all the timeframe scales. Donchian Channel (13) is also demonstrating a negative bias, confirming the trend. At the moment there are no signs of a steady direction looking at the RSI-Bars  oscillator: a channel was formed which has a high probability to be broken downwards at 26.48%. We believe that this signal would coincide with the price level crossing the fractal support at 1.55326. Having reached this level, we would get confirmatory signals: Parabolic values would indicate a bearish slope and Donchian channel would be destroyed. Stop Loss is recommended to be placed above 1.57323, strengthened by the Bill Williams fractal, Parabolic historical values and Donchian Channel upper boundary.

UserPostedImage

After position opening, Stop Loss is to be moved after the Parabolic values, near the next fractal high. Updating is enough to be done every day after a new Bill Williams fractal formation (5 candlesticks). Thus, we are changing the probable profit/loss ratio to the breakeven point.

Position Sell
Sell stop below 1.55326
Stop loss above 1.57323

Dear traders. For the detailed report of the strategy based on analytical issues of technical analysis click here .
IFC Markets
  • Posts: 85
  • Joined: 27/10/2014
Today we consider AUD/USD  currency pair on the H4 chart. The price is moving within the limits of D1 and H4 downtrend channel: bearish trend is observed for all the timeframe scales. Donchian Channel (13) is also demonstrating a negative bias, confirming the trend. At the moment there are no signs of a steady direction looking at the RSI-Bars  oscillator: a local overbought level is formed at 53.7114%, which was confirmed three times by the indicator signal. We believe that the formation of a new high below this level will be preceded by the intersection of a fractal price support level at 0.82183. Having reached this level, we would get confirmatory signals: Parabolic values would indicate a bearish slope and Donchian channel would be destroyed. Stop Loss is recommended to be placed above 0.83743, strengthened by the Bill Williams fractal, Parabolic historical values and Donchian Channel upper boundary.

UserPostedImage

After position opening, Stop Loss is to be moved after the Parabolic values, near the next fractal high. Updating is enough to be done every day after a new Bill Williams fractal formation (5 candlesticks). Thus, we are changing the probable profit/loss ratio to the breakeven point.

Position Sell
Sell stop below 0.82183
Stop loss above 0.83743

Dear traders. For the detailed report of the strategy based on analytical issues of technical analysis click here .
IFC Markets
  • Posts: 85
  • Joined: 27/10/2014
Today at 14:30 CET two key indicators of the US economy are to be released: Core Retail Sales and Unemployment Claims. The first indicator is released monthly by the US Census Bureau and, therefore, it is of interest for position trading. CRS shows a relative change in the total value of sales at the retail level, excluding automobiles, which account for 20% of the total volume. The index defines the consumer confidence. Less important indicator, Initial Claims, is projected on the basis of previous NonFarm performance. The data is published weekly by the Ministry of Labor. The indicator allows evaluating the domestic demand dynamics and the potential of consumer lending for the US economy stimulation. We assume that the release of both indicators would result in significant volatility of the US dollar against the most liquid instruments .

UserPostedImage

Here we consider GBP/USD  currency pair on the H4 chart. The price is moving sideways, which is expected to finish with the support breakout at 1.56418 in the D1 trend direction. It occurs at the same time with the Parabolic downside reversal and the Donchian Channel bias change. Conservative traders are also recommended to get a confirmatory signal on the part of the RSI-Bars  oscillator. At the moment, the oscillator line has approached the local resistance level at 73.8228% and is ready for reversal. The completion of bullish trend should be expected after the breakout at 49.5445%. Partially, Take profit may be possibly placed at 1.55355. Stop Loss is better to be placed at the fractal resistance 1.57587. This mark is confirmed by the upper Donchian Channel boundary.

UserPostedImage

Currently, the volume of futures and options traded on the Chicago Mercantile Exchange has increased significantly up to 180 000 contracts and even higher. You can monitor this data by clicking here . This indicates high liquidity of the currency ahead of a new volatility momentum. The probability of false breakouts in such conditions is low.
After position opening, Stop Loss is to be moved after the Parabolic values, near the next fractal high. Updating is enough to be done every day after a new Bill Williams fractal formation (5 candlesticks). Thus, we are changing the probable profit/loss ratio to the breakeven point.

Position Sell
Sell stop below 1.56418
Stop loss above 1.57587

Dear traders. For the detailed report of the strategy based on analytical issues of technical analysis click here .
IFC Markets
  • Posts: 85
  • Joined: 27/10/2014
Energy market reorganization governed by the US shale technology has led to increased volatility of currencies in developed countries. Volatility correlation of commodity prices and liquid instruments such as USD/JPY, GBP/USD suggests that non-commodity prices are currently behaving not in a traditional way. Today we demonstrate the impact of a new energy age on the national Japanese currency with the help of GeWorko model. Export-oriented economy of Japan benefited from fallen commodity prices. The tumbled prices for Brent futures from $77 to $73 and a further price decline allowed the Bank of Japan to continue the economic stimulus by conducting quantitative easing without a sharp increase in inflation risks: the refinancing rate has remained at zero level. The currency market was unambiguous about this event: yen dipped 2% in a few days after the OPEC summit. Note also that the Japanese trade surplus from February to November has grown 46%, while Brent futures tumbled 39%. These values are comparable. The 20-day correlation between the yen and Brent over that period was 66-85%. Usually it corresponds to correlation with the loonie as a commodity currency during the times of a stable market, but certainly not with the yen.
To take advantage of these trends, we consider the spread trading instrument &WTI_JPY, composed using Personal Composite Instrument - PCI  technology. The basic part of the instrument includes 1 barrel of the US WTI crude oil, and the quoted part - 100 JPY. Get more details and the online &WTI_JPY chart by clicking here . You can also download the instrument for NetTradeX terminal.

UserPostedImage

Here we consider the daily closing/opening price chart of the given instrument. It was composed in NetTradeX trading platform . We can see that the exponential moving average is moving along the bearish trend line, confirming the trend. The price crossed it downwards and broke the fractal support at 71.741. At the same time there was a ParabolicSAR reversal in the direction of the red zone.

Another significant sign of the downtrend is the bearish gap, which was formed immediately after the OPEC meeting. Thus, it confirms our hypothesis about the Japanese monetary policy and investor’s reaction on it. We deem that a short position can be opened immediately, or (for conservative traders) after the MACD line breakout at 1.5036. Stop Loss can be opened at the crossover of the moving average and the trend line at 75.947. This mark is also confirmed by the Bill Williams resistance fractal.

Position Sell
Sell stop below 70.374
Stop loss above 75.947

More information about the mechanism of portfolio operations is available on our website section “Quick Guide for Creating and Trading PCI” .
IFC Markets
  • Posts: 85
  • Joined: 27/10/2014
Here we consider USD/CAD  currency pair on the H4 chart. As oil prices keep falling, the Canadian dollar continues to slump. The price is moving within the limits of D1 and H4 uptrend channel: bullish trend is observed for all the timeframe scales. The trend is confirmed by ParabolicSAR values, which cross the line and fractal support level. Donchian Channel is also indicating the bullish bias. There is no contradiction on the part of the RSI-Bars  oscillator. At the moment, it approached the local resistance level at 76.2609%. We expect that this level would be crossed when the price breaks the resistance level at 1.15294. This mark can be used for opening a pending buy order. Stop Loss is better to be placed at the Bill Williams support fractal 1.15106, which is strengthened by Parabolic historical values.

UserPostedImage

After position opening, Stop Loss is to be moved after the Parabolic values, near the next fractal low. Updating is enough to be done every day after a new Bill Williams fractal formation (5 candlesticks). Thus, we are changing the probable profit/loss ratio to the breakeven point.

Position Buy
Buy stop above 1.15294
Stop loss below 1.15106

Dear traders. For the detailed report of the strategy based on analytical issues of technical analysis click here .
IFC Markets
  • Posts: 85
  • Joined: 27/10/2014
Here we consider GBP/USD  currency pair on the H4 chart. As oil prices keep falling, we observe the US dollar strengthening against the most liquid currencies. The British pound is not an exception. The price is moving within the limits of D1 and H4 downtrend channel: bearish trend is observed for all the timeframe scales. The trend is confirmed by ParabolicSAR values, which cross the trendline and fractal resistance level. Donchian Channel is also indicating the bearish bias. There is no contradiction on the part of the RSI-Bars  oscillator. At the moment, it approached the local support level at 35.3912%. We expect that this level would be crossed when the price breaks the support level at 1.55972. This mark can be used for opening a pending sell order. Stop Loss is better to be placed at the Bill Williams resistance fractal 1.57589, which is strengthened by Parabolic historical values and the bearish pattern “double top” (marked in red ellipse on the chart). We can see that the pound has been drifting sideways for almost a month. It increases the probability of volatility surge and the consolidation completion.

UserPostedImage

After position opening, Stop Loss is to be moved after the Parabolic values, near the next fractal high. Updating is enough to be done every day after a new Bill Williams fractal formation (5 candlesticks). Thus, we are changing the probable profit/loss ratio to the breakeven point.

Position Sell
Sell stop below 1.55972
Stop loss above 1.57589

Dear traders. For the detailed report of the strategy based on analytical issues of technical analysis click here .
IFC Markets
  • Posts: 85
  • Joined: 27/10/2014
Here we consider EUR/USD  currency pair on the H4 chart. As oil prices keep falling, we observe the US dollar strengthening against the most liquid currencies. Euro is not an exception. The price is moving within the limits of D1 downtrend channel: four-hour price rebound is expected to be completed. The price approached ParabolicSAR values which cross the trend line and the fractal resistance level. Meanwhile, Donchian Channel is indicating the bullish bias, but we expect the situation to be changed after the support level breakout at 1.24105. It will coincide with RSI-Bars  oscillator intersection at 50.3743%. At the moment, it has approached the local support level. The price support level can be used for opening a pending sell order. Stop Loss is better to be placed at the Bill Williams resistance fractal 1.25740, which is strengthened by the D1 trend line and the upper Donchian Channel boundary.

UserPostedImage

After position opening, Stop Loss is to be moved after the Parabolic values, near the next fractal high. Updating is enough to be done every day after a new Bill Williams fractal formation (5 candlesticks). Thus, we are changing the probable profit/loss ratio to the breakeven point.

Position Sell
Sell stop below 1.24105
Stop loss above 1.25740

Dear traders. For the detailed report of the strategy based on analytical issues of technical analysis click here .
IFC Markets
  • Posts: 85
  • Joined: 27/10/2014
Let’s consider the H4 chart of USD/CAD  instrument. As oil prices  keep falling, we observe the US dollar strengthening against the most liquid currencies. Canadian dollar, traditionally related to commodity currencies, is not an exception. A price is moving inside an H4 upward tendency. We expect a completion of correction at 1.15544 mark. It is crossed by trend line and a lower boundary of the Donchian Channel. A channel slope has a green zone direction as well. 1.15544 mark can be used for risk mitigation after the long position opening. The fractal resistance level 1.16761 in its turn is comfortable for the pending buy order opening. If it happens then a reverse of ParabolicSAR trend indicator will become probable. At the same time a divergence of RSI-Bars  oscillator is going to complete. We recommend conservative traders to wait for a breakdown of the oscillator resistance mark 52.3319%.

UserPostedImage

After position opening, Stop Loss is to be moved after the Parabolic values, near the next fractal minimum. Updating is enough to be done every day after a new Bill Williams fractal formation (5 candlesticks). Thus, we are changing the probable profit/loss ratio to the breakeven point.

Position BUY
Buy stop higher 1.16761
Stop loss lower 1.15544

Dear traders. For the detailed report of the strategy based on analytical issues of technical analysis click here .
IFC Markets
  • Posts: 85
  • Joined: 27/10/2014
Let’s consider an H4 chart of EUR/USD  instrument. As oil prices  keep falling and FED reports have positive decline, we observe the US dollar strengthening against the most liquid currencies. European currency is not an exception as well. The price keeps moving in frame of H4, D1 tendencies – the scale synchronization is observed. A signal of trend indicator ParabolicSAR slides along a four-hour trend line, thus confirming the bearish direction. The slope of the Donchian channel is also directed toward the red zone. The only alarm at the moment is a breakdown of the RSI-Bars  trend line. The signal can be false only if the 19.3150% support intersection occurs. Most likely, that at this moment the price overcomes a fractal mark of 1.22147, which can be used for pending order opening. At the same time an intersection of Donchian Channel lower boundary is expected. Risks can be limited above the resistance 1.23061, which coincides with the trend line H4 and the historical values of Parabolic.

UserPostedImage

After position opening, Stop Loss is to be moved after the Parabolic values, near the next fractal maximum. Updating is enough to be done every day after a new Bill Williams fractal formation (5 candlesticks). Thus, we are changing the probable profit/loss ratio to the breakeven point.

Position Sell
Sell stop below 1.22147
Stop loss above 1.23061

Dear traders. For the detailed report of the strategy based on analytical issues of technical analysis click here .
IFC Markets
  • Posts: 85
  • Joined: 27/10/2014
Here we consider the USD/CAD  on the H4 chart. The price is consolidated in the sideways and is preparing for a new bullish momentum. ParabolicSAR historical values are moving along the H4 trend line. There was also an important technical signal on the part of the RSI-Bars  oscillator: its values indicated a valid reversal and returned back to the bearish resistance line. We expect the next bar would cross the oscillator resistance line at 61.4968% and it will coincide with the price breakout at 1.16491. Note that this mark is confirmed by the Bill Williams fractal and the upper Donchian Channel boundary. The mark can be used for opening a pending buy order with Stop Loss placed below the support line at 1.15571, which crosses the H4 trend line.

UserPostedImage

After position opening, Stop Loss is to be moved after the Parabolic values, near the next fractal low. Updating is enough to be done every day after a new Bill Williams fractal formation (5 candlesticks). Thus, we are changing the probable profit/loss ratio to the breakeven point.

Position Buy
Buy stop above 1.16491
Stop loss below 1.15571

Dear traders. For the detailed report of the strategy based on analytical issues of technical analysis click here .
IFC Markets
  • Posts: 85
  • Joined: 27/10/2014
Today we consider GBP/USD  currency pair on the H4 chart. The price is moving within the limits of H4, D1 and W1 downtrend channel: bearish trend is observed for all the timeframe scales. ParabolicSAR historical values are moving along the H4 trend line, confirming the investor sentiment. Donchian Channel is also demonstrating the negative bias. There is no contradiction on the part of the RSI-Bars  oscillator: it indicated the daily downtrend. The final bearish confirmation will be obtained when the oscillator bar would cross the support level at 21.9462%. It will likely to coincide with the price breakout at 1.54803. This level is confirmed by the Donchian Channel lower boundary. This mark can be used for opening a pending sell order with Stop Loss placed above the resistance at 1.56163. This is a comfortable position for risk mitigation because the resistance level is strengthened by Parabolic historical values and the D1 trend line. We expect a new volatility momentum of this currency pair after the US Unemployment Claims being released at 14:30 (CET).

UserPostedImage

After position opening, Stop Loss is to be moved after the Parabolic values, near the next fractal high. Updating is enough to be done every day after a new Bill Williams fractal formation (5 candlesticks). Thus, we are changing the probable profit/loss ratio to the breakeven point.

Position Sell
Sell stop below 1.54803
Stop loss above 1.56163

Dear traders. For the detailed report of the strategy based on analytical issues of technical analysis click here .
IFC Markets
  • Posts: 85
  • Joined: 27/10/2014
Let’s consider the H4 chart of USD/JPY  instrument. In spite of long-term bullish mood (D1,W1,…) we observe a downwards correction. Price crossed an upward H4 trend line and entered a narrow range of 119.829-120.927. In case of a flat motion signals of leading oscillators are extremely important. That’s why we recommend paying attention at RSI-Bars  patterns. We observe that an upward tendency slowly turns to the red zone – look at the trends fan. Then a formation of a new bullish trend was fixed (marked by the red corridor) and a simultaneous breakdown of the support level occurred. In such a way the oscillator sent an outrunning signal to the most prudent investors – a direction choice became obvious. The 119.829 support may be used for the pending sell order placement. Risk mitigation may be tied to the fractal resistance of 120.927. This key level was confirmed by the historical values of ParabolicSAR, the upper boundary of Donchian Channel and the intersection of a previous H4 trend line. We suppose that the given scheme of risk control should be comfortable for conservative traders.

UserPostedImage

After position opening, Stop Loss is to be moved after the Parabolic values, near the next fractal high. Updating is enough to be done every day after a new Bill Williams fractal formation (5 candlesticks). Thus, we are changing the probable profit/loss ratio to the breakeven point.

Position Sell
Sell stop below 119.829
Stop loss above 120.927

Dear traders. For the detailed report of the strategy based on analytical issues of technical analysis click here .
IFC Markets
  • Posts: 85
  • Joined: 27/10/2014
Today we consider EUR/USD currency pair on the D1 chart. In line with long-term bullish players (W1), there is a bearish momentum formation on the daily chart. Parabolic historical values are moving along the D1 downtrend line, confirming the market sentiment. Donchian Channel is also demonstrating the negative bias. The only alarming signal comes from the RSI-Bars  oscillator: it indicates the sideways movement. The support breakout at 27.5216% may be considered as a confirmatory signal. It is expected to be preceded by a strong bearish momentum and the price level intersection at 1.21576. This mark can be used for opening a pending sell order with Stop Loss placed above the fractal resistance at 1.25768. This key level is also confirmed by ParabolicSAR historical values, the upper Donchian Channel boundary, and the D1 trend line crossing. We deem that the proposed scheme of risk management should be comfortable for conservative traders.

UserPostedImage

After position opening, Stop Loss is to be moved after the Parabolic values, near the next fractal high. Updating is enough to be done every day after a new Bill Williams fractal formation (5 candlesticks). Thus, we are changing the probable profit/loss ratio to the breakeven point.

Position Sell
Sell stop below 1.21576
Stop loss above 1.25768

Dear traders. For the detailed report of the strategy based on analytical issues of technical analysis click here .
IFC Markets
  • Posts: 85
  • Joined: 27/10/2014
Today the monthly Consumer Confidence index will be released at 16:00 CET in the United States. The index provides a growth estimate of consumer spending. It is based on household survey. The indicator measures labor availability, business conditions, therefore, it is particularly interesting for investors. At that time we expect a volatility momentum on the US currency market. Let’s consider GBP/USD currency pair on the H4 chart. The major D1 trend and the H4 trend are influenced by bears. Parabolic historical values are moving along the trend line, confirming the investor sentiment.

At the moment Donchian Channel is consolidated: a new momentum is about to appear and retracement is to be completed. There is no contradiction on the part of the RSI-Bars  oscillator. Moreover, the double bottom pattern was breached (marked in red ellipse) and the last three bars are located below this level. The price mark at 1.54939 can be used for opening a pending sell order. This level is confirmed by Parabolic historical values and the lower Donchian Channel boundary. Please note that this level and the trend line form a triangle with a bearish slope. Stop Loss can be placed at the fractal 1.56108, located above the trend line.

UserPostedImage

After position opening, Stop Loss is to be moved after the Parabolic values, near the next fractal high. Updating is enough to be done every day after a new Bill Williams fractal formation (5 candlesticks). Thus, we are changing the probable profit/loss ratio to the breakeven point.

Dear traders, analytical department of IFC Markets is wishing you love, health, professional progress and, of course, successful trading! Happy New Year!

Position Sell
Sell stop below 1.54939
Stop loss above 1.56108

Dear traders. For the detailed report of the strategy based on analytical issues of technical analysis click here .
IFC Markets
  • Posts: 85
  • Joined: 27/10/2014
Today we consider USD/JPY  currency pair on the H4 chart. Last week the markets reacted to the statement made by the ECB President Mario Draghi, who made it clear that the deflation possibility in the euro zone has increased. It means that the EU financial system is not adapted to new conditions which were settled after the crisis, so the financial recovery leader still remains to be the United States. After that, investors started to hedge risks, converting deposits into USD. This has resulted in greenback strengthening against the most liquid currencies, including the Japanese yen. However, the growth potential is not yet fully exposed: last week the yen tested the resistance for three times 120.822, without having a breakout. Along with that, a bullish gap and the ascending triangle appeared. The triangle was formed by the H4 support and resistance. Both signals indicate the bullish investor sentiment. ParabolicSAR historical values are moving along the trend line, confirming the price direction. We will wait for a new volatility momentum after the price crosses the double top pattern (marked in red ellipse). This level can be used for placing a pending buy order.

UserPostedImage

Conservative traders are also recommended to wait for the resistance line breakout of the RSI-Bars  oscillator and the trading volume to reach above the local low. At the moment the market is recovering after holidays. The daily volume of contracts traded on the Chicago Mercantile Exchange has not yet outperformed 150000. We will expect this mark to be exceeded to confirm short-term trends on the H4 timeframe. To monitor the volumes click here .

UserPostedImage

Stop Loss can be placed at the fractal support 118.772. This mark is confirmed by the lower DonchianChannel boundary. In case of the channel breakout, after the position opening, Stop Loss is to be moved after the Parabolic values, near the next fractal low. Updating is enough to be done every day after a new Bill Williams fractal formation (5 candlesticks). Thus, we are changing the probable profit/loss ratio to the breakeven point.

Buy Stop above 120.822
Stop Loss below 118.772

Dear traders. For the detailed report of the strategy based on analytical issues of technical analysis click here .
IFC Markets
  • Posts: 85
  • Joined: 27/10/2014
Today at 16:00 CET we expect ISM Non-Manufacturing PMI to be published in the US. The index is released monthly by the Institute for Supply Management, on the third trading day. ISM index is the result of a monthly survey of more than 400 purchasing managers, excluding the manufacturing industry. Purchasing managers are asked about employment, price levels, suppliers, and inventories. If the index is below 50, it indicates economic recession due to reduced activity, especially if the trend remains for several months. We expect the index release would result in volatility momentum of the most liquid currencies against the US dollar.

Here we consider GBP/USD currency pair on the D1 chart. The bearish trend channel has approached the significant support line (MN). At the moment, Parabolic historical values are moving along the D1 trend line. Donchian Channel is also demonstrating the negative bias. Thus, there are no technical conditions for the trend slowing. We also see that the last bar of the RSI-Bars  oscillator crossed the trend line. The trend direction is changing towards the red zone, excluding the divergence to happen. The fractal support breakout at 1.51851 would surely result in a new large-scale weakening of the British pound. This mark can be used for opening a pending sell order. On the other hand, the trend stability may not be sufficient for the MN support line breakout. Therefore, the second pending order is placed above the closest resistance at 1.56038. Risk mitigation levels are placed symmetrically.

UserPostedImage

Conservative traders are also recommended to wait for the trading volume to reach above the local high. At the moment the market is recovering after holidays. The daily volume of contracts traded on the Chicago Mercantile Exchange has not yet outperformed 120000. We will expect this mark to be exceeded to confirm the trend. To monitor the trading volumes click here .

UserPostedImage

Buy Stop above 1.56038
Stop Loss below 1.51851

Sell Stop below 1.51851
Stop Loss above 1.56038

Dear traders. For the detailed report of the strategy based on analytical issues of technical analysis click here .
IFC Markets
  • Posts: 85
  • Joined: 27/10/2014
Today at 14:30 CET we expect the Trade Balance releases in the US and Canada. Besides, 15 minutes earlier the monthly Non-Farm Employment Change will be published by Automatic Data Processing. The indicator is based on the study of anonymous data of about 400.000 business clients, excluding the farming industry and government. The preliminary outlook of the employment growth is released 2 days ahead the Nonfarm publication. This is the reason this indicator is worth a closer look. Employment is the key factor influencing the US consumer demand. If the data is better-than-expected, it will almost certainly result in the US currency strengthening.

UserPostedImage

Here we consider USD/CAD  currency pair on the H4 chart. As heavy crude oil prices plunge, the Canadian “quasi-commodity” currency continues to slump. At the moment the graphical analysis indicates two bullish signals: the price leaving the triangle in the direction of the green zone and the H4 resistance line breakout. However, the fractal breakout is not confirmed by the RSI-Bars  oscillator. It is recommended to wait for the oscillator breakout at 84.3602% for position opening. Other trend indicators confirm the bullish market sentiment. Stop Loss can be placed at 1.17239. This mark is confirmed by Parabolic historical values and the Bill Williams fractal. If negative statistics will be released in the US, this mark may be used for placing the opposite order. In this case, the price would return into the limits of the trend channel and the trend pace would slow down.

UserPostedImage

However, this situation has little chances to be developed. As the figure shows, the volume of CAD futures contracts traded on the Chicago Mercantile Exchange is going up, so that it confirms the trend stability. Conservative traders are recommended to wait for the trading volume to outperform the level of 80 000 contracts. We will expect this mark to be exceeded to confirm the trend. To monitor the trading volumes click here .

Dear traders. For the detailed report of the strategy based on analytical issues of technical analysis click here .
IFC Markets
  • Posts: 85
  • Joined: 27/10/2014
The inflation data released yesterday in the EU added strong pressure on the euro: the monthly released Consumer Price Index CPI indicated negative trend. In annual terms the index lost 0.2%, confirming the worst investor concerns. Deflation in the euro zone is becoming real, and it means there are more chances for the ECB to start the promised money printing. Even more pressure on the euro was added by the Wednesday’s shooting in France and no significant progress in catching the suspects. Today at 14:30 CET we expect the release of Unemployment Claims in the US. The report is released weekly by the US Department of Labor. The indicator allows estimating the domestic demand dynamics and the consumer loan potential for the US economy stimulus. If the indicator performance is better than the one released earlier (298 thousand contracts), it may lead to the euro plunge against the greenback.

UserPostedImage

Here we consider EUR/USD  currency pair on the H4 chart. The last euro retracement finished with the doji candlestick pattern (marked in red ellipse on the chart). Bulls are completely exhausted and right after a timid surge, the euro continued free-falling. However, nearby there is the daily resistance line which can cause a slight retracement: you should be careful. Fortunately, we have RSI-Bars  oscillator at hand, so it can filter the false breakout. Now its values are located inside the bearish triangle. We would wait for a significant price channel breakout after the oscillator crosses 18.8551%. It is more likely to happen after the price intersection of the fractal support at 1.17957. This mark can be used by aggressive traders for placing a pending sell order, but we recommend them to monitor the oscillator chart. Stop Loss can be placed at 1.8989. This mark is confirmed by Parabolic historical values and Bill Williams fractal. After order execution, Stop Loss is to be moved near the next fractal high. Thus, we are changing the probable profit/loss ratio to the breakeven point.

UserPostedImage

However, the situation of a strong retracement has little chances to happen. According to the figure, the volume of euro futures traded on the Chicago Mercantile Exchange is going up, confirming the trend. To monitor the volumes click here .

Dear traders. For the detailed report of the strategy based on analytical issues of technical analysis click here .
IFC Markets
  • Posts: 85
  • Joined: 27/10/2014
Today a few fundamental indicators of the Canadian economy are released at 14:30 CET: Building Permits, Employment Change and Unemployment Rate. The first indicator is published monthly and indicates the number of permits for new construction, issued by the government. The indicator allows estimating the growth potential of real estate sector and, as a consequence, we can assess the increase in consumption of secondary demand and technology goods. Taking the labor market data into account, this indicator determines the consumer demand in Canada. At the same time, all currency traders are looking forward to the labor market data released in the United States: Non-Farm Employment Change, which is published every month by the US Labor Department. The indicator change has a strong impact on consumer spending and investment appeal of the United States. It is also important to note that the indicator is published among the first ones and has a long-term impact on the market (up to one week). Thus, we assume that a new volatility momentum for USD/CAD currency pair is possible to surge at 14:30.

UserPostedImage

Here we consider USD/CAD  on the H4 chart. The price reached the daily resistance line, made a reversal and formed a pullback. The preliminary trend line is made on the basis of ParabolicSAR historical values. RSI-Bars  oscillator confirms the bearish signal: the final confirmation would be received after the breakout at 55.1948%. It will be likely to happen ahead of the price intersection of the fractal level at 1.17933. This mark can be used for placing a pending sell order. There are high chances to observe a short-term retracement because traders take profits before the Nonfarm release. As seen on the chart, the current candlestick is preceded by the “absorption” pattern, which includes doji: bears are still winning. Stop Loss can be placed at 1.18733. This mark is confirmed by Parabolic historical values, the Bill Williams fractal and the upper Donchian Channel boundary. After order execution, Stop Loss is to be moved near the next fractal high. Thus, we are changing the probable profit/loss ratio to the breakeven point.

UserPostedImage

However, the possibility of the CAD long-term retracement is not yet confirmed by the trading volume. According to the figure, the volume of CAD futures traded on the Chicago Mercantile Exchange is going up, but hasn’t still outperformed the high of 80000 contracts. To monitor the volumes click here .

Position Sell
Sell stop below 1.17933
Stop loss above 1.18733

Dear traders. For the detailed report of the strategy based on analytical issues of technical analysis click here .
IFC Markets
  • Posts: 85
  • Joined: 27/10/2014
Here we consider EUR/USD  currency pair on the H4 chart. The US dollar slid after Buiding Permits were released on Friday. It resulted in the price retracement inside the bearish trend channel. However, we expect the general trend to continue: as soon as the price approached the resistance line, bearish pattern “absorption” was formed. The retracement completion can be connected with the strong level crossing at 1.17487. This mark is strengthened by the double bottom pattern (marked in red ellipse). Stop Loss can be placed above the last fractal at 1.18767. Conservative traders are recommended to wait for the RSI-Bars  oscillator confirmation: it is necessary to wait for the bullish trend to be completed at the support breakout 27.1330%. After order execution, Stop Loss is to be moved near the next fractal high. Thus, we are changing the probable profit/loss ratio to the breakeven point.

UserPostedImage

Position Sell
Sell stop below 1.17487
Stop loss above 1.18767

Dear traders. For the detailed report of the strategy based on analytical issues of technical analysis click here .
IFC Markets
  • Posts: 85
  • Joined: 27/10/2014
Today at 10:30 CET we expect the release of CPI/Consumer price index in the UK. The index is published monthly by the Office for National Statistics, and represents performance of the previous year. This form of representation allows avoiding the influence of seasonal factors on inflation rate. CPI is calculated on the basis of various goods and services. It is considered to be the main inflation indicator of the UK economy and is taken into account when the Bank of England is changing the base lending rate. The index increase amid favourable economic conditions usually leads to the British pound strengthening. Moderate inflation is also welcomed by investors as an indicator of natural economic growth. As deflation hit the EU, the risen UK CPI could attract additional investment and strengthen the national currency. We deem the news released today would result in volatility momentum of the British pound.

UserPostedImage

Here we consider GBP/USD  currency pair on the H4 chart. The price is centered between the resistance of bearish pattern “double top” (marked in red ellipse) and the strong MN support line at 1.50305. The resistance line is located at the previous support level 1.51943, which provides extra significance. However, a bullish trend channel has begun its formation, and Parabolic values are moving along the uptrend support line. We believe bulls determine the price direction now. RSI-Bars  oscillator confirms the trend. The only alarming sign is its trend line breakout. Conservative traders are recommended to wait for the RSI-Bars oscillator confirmation: the breakout at 55.5446%. We believe that it will happen after the price overcomes the double top level, which can be used for placing a pending buy order. Stop Loss can be placed at the MN support line, which is confirmed by the lower Donchian Channel boundary and the Bill Williams fractal. After order execution, Stop Loss is to be moved near the next fractal low. Thus, we are changing the probable profit/loss ratio to the breakeven point.

UserPostedImage

We have every reason to believe the uptrend to persist. The futures volume traded on the Chicago Mercantile Exchange dropped significantly. The current daily GBP retracement is not the formation of a new trend, so we expect the British pound to increase. The most cautious investors should wait for the level of 125000 contracts to be outperformed.

Position Buy
Buy stop above 1.51943
Stop loss below 1.50305

Dear traders. For the detailed report of the strategy based on analytical issues of technical analysis click here .
IFC Markets
  • Posts: 85
  • Joined: 27/10/2014
Today at 14:30 CET we expect CRS/Core Retail Sales to be published in the United States. The index is released monthly by the Census Bureau and indicates a relative change in the volume of retail sales, excluding automobiles (20% of the total volume). CRS estimates consumer spending. It is based on retail stores sampling of different types and sizes. This indicator measures consumer confidence, so it is of considerable interest for long-term investors. We deem the news released today would cause volatility momentum of the US dollar against the most liquid currencies, including euro.

UserPostedImage

Here we consider EUR/USD  currency pair on the H4 chart. The price is consolidated inside the bearish triangle. The market neutrality trend will be finished with the release of new significant statistics. The triangle bias is also confirmed by ParabolicSAR historical values that move along the upper triangle side. At the same time there is a bullish divergence on the RSI-Bars  oscillator chart: it creates a conflicting picture of technical analysis. In this situation, we need to consider both cases. It is recommended to place two pending orders, Buy Stop and Sell Stop, near the sideways channel borders. We emphasize that channel levels 1.17456 and 1.18791 are confirmed by DonchianChannel and Bill Williams fractals. The upper level is further strengthened by bearish “double top” pattern.

Risk mitigation is to be placed at the opposite levels. After order execution, another one may be cancelled. Stop Loss is to be moved after Parabolic values near the next fractal low (long position), or fractal high (short position). Thus, we are changing the probable profit/loss ratio to the breakeven point.

Position Buy
Buy stop above 1.18791
Stop loss below 1.17456

Position Sell
Sell stop below 1.17456
Stop loss above 1.18791

Dear traders. For the detailed report of the strategy based on analytical issues of technical analysis click here .
IFC Markets
  • Posts: 85
  • Joined: 27/10/2014
Today at 14:30 CET Unemployment Claims will be released in the US. The data is published weekly by the US Department of Labor. This indicator measures domestic demand dynamics and the consumer lending potential for the US economy stimulus. It is of considerable interest for long-term and medium-term investors. We deem the news released today would cause volatility momentum of the US dollar against the most liquid currencies.

UserPostedImage

Here we consider GBP/USD  on the H4 chart. The price crossed a triple top pattern (marked in yellow) and returned to the support level at 1.51853. For this reason, this mark can be used for placing Stop Loss when opening a long position. Since ParabolicSAR values move along the trend line and Donchian Channel has reversed in negative direction, there is every reason to believe that bulls are gaining strength. There is no contradiction on the part of the RSI-Bars  oscillator: it confirms the trend. The next volatility momentum can be expected after resistance level overcoming at 68.4128%. We expect it will accompany the price level intersection at 1.52711, which can be used for placing a pending buy order. After your order was being opened, Stop Loss is to be moved after Parabolic values near the next fractal low. Thus, we are changing the probable profit/loss ratio to the breakeven point. Conservative traders may also consider the alternative case, which is possible to happen if positive US data is released. Thus, a pending sell order may be placed at the support breakout below 1.51052.

Position Buy
Buy stop above 1.52711
Stop loss below 1.51853

Position Sell
Sell stop below 1.51052
Stop loss above 1.52711

Dear traders. For the detailed report of the strategy based on analytical issues of technical analysis click here .
IFC Markets
  • Posts: 85
  • Joined: 27/10/2014
Today at 14:30 CET Core CPI m/m will be released in the United States. The index is published monthly by the Bureau of Labor Statistics. It measures the change in prices for goods and services, excluding the most volatile components: food and energy. The indicator measures inflation, which in turn affects the US monetary policy and base rates. Members of the Federal Open Market Committee (FOMC) take the inflation outlook into account to restrain its excessive growth pace due to tightening policy. Rate hike leads to an influx of investment funds in the economy. For this reason, CPI release may cause volatility momentum of the US dollar against the most liquid currencies.

UserPostedImage

Here we consider EUR/USD  currency pair on the H4 chart. The Swiss National Bank (SNB) turned down the protection policy of the average exchange rate of two currencies (EUR,CHF) at 1.20 francs per euro. The regulator was forced to take this measure amid long-term euro depreciation. Floating exchange rate made the European currency soar even deeper and triggered a sell-off. We can observe the daily bearish trend, which proceeded after a slight retracement within the channel 1.16132-1.17252. Parabolic historical values are moving along the trend line, confirming its strength. You should also pay attention to the bullish divergence completion on the RSI-Bars  oscillator chart and the trend reversal. Dashed line marks the preliminary trend line which will be confirmed only after the support level intersection at 18.4161%. We expect it will accompany the price level crossing at 1.15665, which can be used for placing a pending sell order. Stop Loss can be placed above the last strong support at 1.17252, which now acts as resistance line. After order opening, Stop Loss is to be moved after Parabolic values near the next fractal high. Thus, we are changing the probable profit/loss ratio to the breakeven point.

UserPostedImage

The volumes of futures and options on euro traded on the Chicago Mercantile Exchange has increased greatly after yesterday’s news. The number of contracts outperformed the local peak of 400 000 and has continued to grow as the trend is developing. The volume confirms the bearish sentiment and investor fears on the European currency.

Position Sell
Sell stop below 1.15665
Stop loss above 1.17252

Dear traders. For the detailed report of the strategy based on analytical issues of technical analysis click here .
IFC Markets
  • Posts: 85
  • Joined: 27/10/2014
Today at 13:00 CET the Bundesbank monthly report will be released. It contains articles, speeches, statistics and etc. The German GDP is ranking at the top of the EU members. Therefore, the regulator’s report affects greatly capital markets if the official ECB stance differs from the Bundesbank data. According to the ECB latest statement, deflationary risks are rising and the labor market is recovering in a slow pace. The Germany’s central bank report is monitored by long-term and medium-term investors with utmost care.

UserPostedImage

Here we consider EUR/USD  on the H4 chart. The price crossed upwards the H4 trend line, which is the first sign that bulls are gaining strength. At the same time, there is a weak bullish divergence on the RSI-Bars  oscillator chart, despite the trend line reversal. The bullish trend is likely to strengthen in case of a resistance level breakout at 1.16554. In this case, Stop Loss is recommended to be placed below the last fractal support at 1.14586. This mark is strengthened by the lower boundary of DonchianChannel. The second alternative situation assumes the trend continuation after the retracement is finished. Note that Parabolic trend indicator is currently confirming the bearish direction. In such a situation, a pending order can be placed at opposite levels. Let the market choose the price direction. After order execution, another one may be cancelled. Stop Loss is to be moved after Parabolic values near the next fractal low (long position), or fractal high (short position). Thus, we are changing the probable profit/loss ratio to the breakeven point.

Position Buy
Buy stop above 1.16554
Stop loss below 1.14586

Position Sell
Sell stop below 1.14586
Stop loss above 1.16554

Dear traders. For the detailed report of the strategy based on analytical issues of technical analysis click here .
IFC Markets
  • Posts: 85
  • Joined: 27/10/2014
Today at 14:30 CET Manufacturing sales will be released in Canada. The indicator is published monthly by Statistics Canada. It’s a leading indicator of consumer spending and employment. For this reason the statistics is important for investors who expect the potential dividends from long-term investment. We assume that the indicator release may result in increased volatility of the Canadian dollar against other liquid currencies.

UserPostedImage

In order to diversify investment possibilities, today we consider USD/CA D on the D1 chart. The price crossed the strong weekly resistance line and formed a new daily uptrend channel. It was accompanied by the breakout of the upper triangle side, which has a bullish bias. ParabolicSAR historical values move along the trend line, increasing its strength. RSI-Bars  oscillator also confirms the trend. There is no contradiction on the part of DonchianChannel (13). The price is moving along the upper border, constantly updating the channel peaks. Bulls gained a massive foothold. We deem the next bullish momentum would occur after the fractal resistance crossing at 1.20515. This mark can be used for placing a pending buy order. Conservative investors should wait for the oscillator breakout at 85.0433% to confirm the price breakout. Stop Loss is to be placed below the last support at 1.17792, which is confirmed by the trend line and Parabolic historical values. After order opening, Stop Loss is to be moved after Parabolic values near the next fractal low. Thus, we are changing the probable profit/loss ratio to the breakeven point.

UserPostedImage

At the moment, the volume of CAD futures traded on the Chicago Mercantile Exchange doesn’t confirm the trend: the level of 120 000 contracts has been outperformed. The most cautious investors are recommended to wait for the breakout of this level to verify the bullish market. You can monitor the trading volumes by clicking here .

Position Buy
Buy stop above 1.20515
Stop loss below 1.17792

Dear traders. For the detailed report of the strategy based on analytical issues of technical analysis click here .
IFC Markets
  • Posts: 85
  • Joined: 27/10/2014
Today at 14:30 CET Building Permits will be released in the United States. The indicator is published monthly and indicates a number of permits for new construction, issued by the government. It allows estimating the growth potential of the real estate sector. As a result, we can assess the increase in the consumption of secondary demand goods and the ones of the technology sector.

UserPostedImage

Today we consider the GBP/USD  currency pair on the D1 chart. The price came closer to the weekly support line: we expect a reversal into the green zone direction. The RSI-Bars  oscillator has been showing a weak bullish divergence for a month, and over the past few days there has been an upward momentum that should lead to the resistance level breakout at 39.3211%. We assume it will accompany the price level breaking at 1.52776. This mark can be used for placing a pending buy order. After the resistance level is broken, Parabolic indicator will change the bias into the bullish one and DonchianChannel’s upper boundary would be reached. Therefore, we would get the last missing confirming signals. Stop Loss can be placed below the daily support line at the last fractal low 1.50246. After order opening, Stop Loss is to be moved after Parabolic values near the next fractal low. Thus, we are changing the probable profit/loss ratio to the breakeven point.

UserPostedImage

Currently, the volume of GBP futures traded on the Chicago Mercantile Exchange doesn’t confirm the trend: the level of 170 000 contracts hasn’t been outperformed. The most cautious investors are recommended to wait for the breakout of this level to verify the bullish market. For tracking trading volumes, please visit the Chicago Mercantile Exchange (CME) website.

Position Buy
Buy stop above 1.52776
Stop loss below 1.50246

Dear traders. For the detailed report of the strategy based on analytical issues of technical analysis click here .
IFC Markets
  • Posts: 85
  • Joined: 27/10/2014
We continue to keep an eye on the euro as the ECB launched quantitative easing program. Recall that the regulator will start money printing this March. This is a bond-buying program in the amount of 60 billion euro paid monthly. The program will last until September of the next year, and the total amount will exceed 1 trillion euro. The event is a milestone for long-term investors: the cash filling would bolster exporters, but it currently leads to the euro depreciation and inflation in the eurozone. The euro opened with a bearish gap on Monday (D1 chart). Positive data on business climate in Germany softened the market reaction: there is a possibility of a weak retracement which can be used to search for a suitable entry point. Eurogroup will hold another emergency meeting due to growing conflict in Eastern Ukraine. The meeting results are not really promising for strengthening trade relations of the EU. The issue on the next round of sanctions will be raised; therefore, we expect a new impetus of euro weakening.

UserPostedImage

We can see that EUR/USD  has accelerated in falling, breaking the weekly and daily support lines. The current daily price channel is confirmed by the lower Donchian Channel and Parabolic historical values. We expect the confirmation of the last breakout on the RSI-Bars  oscillator chart. After the bar breaks the level at 10.4633%, we will get the signal for going short. It will probably coincide with the local support price breakout at 1.10969. This mark can be used for opening a pending sell order. Stop Loss is to be placed at the resistance line, for example, below the last fractal support at 1.14320. After order opening, Stop Loss is to be moved after Parabolic values near the next fractal high. Thus, we are changing the probable profit/loss ratio to the breakeven point. Partially, 50% of the position can be closed near the monthly support line.

Position Sell
Sell stop below 1.10969
Stop loss above 1.14320
IFC Markets
  • Posts: 85
  • Joined: 27/10/2014
Let’s consider an H4 chart of GBP/USD  trading instrument. The price has tested a daily support level (1.49359), but has failed to punch it eventually. This marks a sudden change of market sentiment in favor of bullish momentum. We emphasize that the significance of this mark is confirmed by historical values of Parabolic trend indicator, fractal of Bill Williams, as well as the lower boundary of the Donchian channel. However RSI-Bars  bullish divergence is definitely the most remarkable signal which is observed from the beginning of January. Current bars are located in the vicinity of 58.8971% resistance level.

UserPostedImage

We suppose that a breakdown of this level may be a final confirmation of a counter trend movement. Most likely it will occur after the crossing of local price resistance 1.51339, which can be used for the BUY pending order placement. Risks should be limited below the daily fractal resistance (1.49359). After order opening, Stop Loss is to be moved after Parabolic values near the next fractal minimum. Thus, we are changing the probable profit/loss ratio to the breakeven point.

Position Buy
Buy stop above 1.51339
Stop loss below 1.49359
IFC Markets
  • Posts: 85
  • Joined: 27/10/2014
Let’s consider the EUR/USD currency pair on the H4 chart. We continue to keep an eye on euro as ECB announced quantitative easing program. Recall that the ECB regulator will start printing money this March. The planned bond-buying program amounts to 60 billion euro every month. The QE program will last till September 2016, with total purchases surpassing 1 trillion euro. This event is a landmark for long-term investors: the liquidity filling will support exporters, but currently it leads to euro weakening and causes inflation in the euro zone. As a result, the monthly and weekly movements of EUR/USD are still negative: major investors are fretted, and we won’t try to resist the policy of financial institutions, analyzing only sell signals.

UserPostedImage

The H4 trend is fully consistent with the long-term trends. The price currently shows the consolidation period: this uncertainty is determined by geopolitical tension in Ukraine and the first profit-taking by the traders who went short. We expect a new volatility impetus after the price breaks the triangle downwards. A pending sell order may be opened below the support level at 1.12540, which is confirmed by the lower boundary of Donchian Channel and the Bill Williams fractal. Conservative traders are recommended to confirm the price breakout based on the oscillator signal. At the moment RSI-Bars  indicates the trend reversal in favour of bears. The "double top" bearish pattern was formed at 55.3694%. The final confirmation of the price breakout can be obtained after the oscillator bar overcomes the support level at 38.6066%. Stop Loss is to be placed above 1.13888. This mark is confirmed by Parabolic historical values and the last resistance fractal. After order opening, Stop Loss is to be moved after Parabolic values near the next fractal high. Thus, we are changing the probable profit/loss ratio to the breakeven point.

Position Sell
Sell stop below 1.12540
Stop loss above 1.13888

Dear traders. For the detailed report of the strategy based on analytical issues of technical analysis click here .
IFC Markets
  • Posts: 85
  • Joined: 27/10/2014
Let us consider the GBP/USD currency pair on the H4 chart. The H4 and daily trends have a bearish momentum: we observe synchronizing scales that make us more confident about short position opening. ParabolicSAR values are moving along the current trend, confirming its negative bias. The last fractal support, strengthened by the lower boundary of Donchain Channel, is tracing an important level. Its breakout is likely to result in a strong volatile movement towards the red zone. The 1.49802 mark may be used for placing a pending sell order. We recommend conservative traders to wait for confirmation from RSI-Bars  oscillator, which has to breach the 34.4285% level simultaneously. In such a manner, we will get verification from every analytical instrument available.

UserPostedImage

Stop loss may be placed in advance at 1.51003 support level. We would like to point out that this mark is confirmed by two Bill Williams’s fractals (double bottom), the upper boundary of Donchain Channel and by Parabolic historical values. This level can be broken up only in case of fundamental changes in market structure. If this occurs, the price will cross both the daily and H4 trend lines, with bulls taking the initiative. Taking the current situation into account, this is unlikely to happen. After pending order placing, stop loss is to be moved every four hours near the next fractal low, following Parabolic signals. Thus, we are changing the probable profit/loss ratio to the breakeven point. If the price meets stop loss level without reaching the order, we recommend canceling the position: market sustains internal changes that were not considered.

Position Sell
Sell stop below 1.49802
Stop loss above 1.51003
IFC Markets
  • Posts: 85
  • Joined: 27/10/2014
Today at 14:45 CET ADP Non-Farm Employment Change indicator will be issued in the US. The index is provided by Automatic Data Processing every month and is based on reckoning anonymous data of about 400 000 American business clients. Agriculture and government sectors are not included in the filing. The preliminary estimate is announced 2 days ahead of official Non-Farm Employment Change release. That is why the indicator deserves a closer look. Employment is a key factor, affecting consumer demand in the USA; a worse-than-expected decline in Non-Farm Employment Change is likely to pull down the American currency. We recall that Canada’s Ivey PMI will become public today at 16:00 CET. A survey among 175 purchasing managers from different economy sectors evaluates employment, production, new orders, prices, supply and reserves. This indicator estimates expansion or contraction in production together with purchasing managers’ activity. The USD/CAD  currency pair is expected to become more volatile after the data publication.

UserPostedImage

Let us consider the USD/CAD:H4 chart. After leaving the triangle, the price crossed the H4 resistance line. At the moment we observe a pullback as oil prices sagged: reduced number of US oil wells and strike of several trade unions resulted in crude oil rally. Yet, $50-55 a barrel keep 80% percent of American oil pumps cost efficient, so we expect a downward movement to be on the way. Bullish momentum will be continued if 1.28112 fractal resistance is breached; you may place a long pending order at this mark. However, we advise you to keep an eye on the RSI-Bars  oscillator, which latest bar broke through the support line. Conservative traders are recommended to wait until the price is back into the bullish trend corridor. Stop loss may be placed at the previous resistance level, which can be now considered as the support line – 1.22514. After pending order placing, Stop loss is to be moved every four hours near the next fractal low, following Parabolic signals. Thus, we are changing the probable profit/loss ratio to the breakeven point. If the price meets stop loss level without reaching the order, we recommend canceling the position: market sustains internal changes that were not considered.

Position Buy
Buy stop above 1.28112
Stop loss below 1.22514
IFC Markets
  • Posts: 85
  • Joined: 27/10/2014
Today at 12:00 СЕТ the Bank of England is to hold a regular meeting. Investors expect the interest rate to remain the same (0,5%) and are moderately pessimistic about English economy current state. Pound has been strengthening against dollar for 3 consequent days, owing to good Manufacturing, Construction and Services PMI, issued on Monday, Tuesday and Wednesday, respectively. Jobless Claims and Q4 Non-Farm Productivity are announced at 13:30 CET today in the USA: estimated data are relatively weak. At the same time US Trade Balance for December will become public. It is likely to be positive, but overall statistics may undermine the American currency. Our analysts believe the data publication will reinforce GBP/USD. Over the last six months pound has lost 11% against greenback. It is high time for the pound to rebound.

UserPostedImage

Let us consider the GBP/USD currency pair on the H4 chart. Leaving behind the down trend, the price breached the H4 resistance line. We observe a surge, which followed pullback to the trend line. Bullish momentum will be continued if 1.52757 fractal resistance is crossed: you may place a long pending order at this mark. However, we advise you to keep an eye on the RSI-Bars oscillator, which is overbought. Conservative traders are recommended to wait until the price gap (which was developed in January, 2-5) is bridged. Stop loss may be placed at the level of 1.511, indicated most recently by Parabolic. This mark can be now considered as the support line. After pending order placing, Stop loss is to be moved every four hours near the next fractal low, following Parabolic signals. Thus, we are changing the probable profit/loss ratio to the breakeven point. If the price meets Stop loss level without reaching the order, we recommend canceling the position: market sustains internal changes that were not considered.

Position Buy
Buy stop above 1.52757
Stop loss below 1.511
IFC Markets
  • Posts: 85
  • Joined: 27/10/2014
Let us consider the USD/CHF  H4 chart. The instrument clearly moves sideways, depreciating trend indicators. That is why our attention is drawn mainly to graphic patterns and oscillators, able to filter out false breakouts. At the moment we observe a bearish-biased triangle. The trend is also confirmed by the RSI-Bars  oscillator, indicating the movement towards the red zone. In this regard we deal with sell signals only.

UserPostedImage

An important support line is formed currently at 0.91532. It is confirmed by the Donchian Channel lower boundary and 2 Bill Williams fractals. We recommend making sure the support breakout is accompanied with breaching the oscillator support of 42.2748%. A sell pending order may be placed at this level. Stop loss may be placed at the triangle height of 0.93475. This mark is also confirmed by the Parabolic values. You may partly close the position at 0.89824, which conforms to historical fractal support. After pending order activation, Stop loss is to be moved every four hours near the next fractal high, following Parabolic signals. Thus, we are changing the probable profit/loss ratio to the breakeven point. If the price meets Stop loss level without reaching the order, we recommend canceling the position: market sustains internal changes that were not considered.

Position Sell
Sell stop below 0.91532
Stop loss above 0.93475

IFC Markets
  • Posts: 85
  • Joined: 27/10/2014
Let us analyze the USD/JPY pair on the H4 chart. This morning Japan announced several minor economic indicators. They appeared to be negative. Q4 Housing Loans and Tertiary Industry Index for December turned out to be worse-than-expected. To be noted, Industrial Production for December will be released on Wednesday at 23:50 CET in Japan. The tentative outlook is positive for yen, resulting in USD/JPY currency pair downward movement. It is to be considered when trading, as well as the fact that no important Japanese macroeconomic data are expected this week. Today at 15:00 CET Wholesale Inventories will be issued in the USA. The forecast is neutral. Market may react, if real figures deviate widely from estimated ones.

UserPostedImage

On the H4 time frame the USD/JPY steadily moved far above the triangle. Then it showed a slight pullback and formed a “flag” pattern. As a rule, it implies the current trend, which is the uptrend now, to continue. The RSI-Bars oscillator shaped a combination of similar figures, which confirms the trend in our judgment. The RSI latest bars didn’t go below 50. This is a good “bullish” sign, supposing yen to weaken further. To be kept in mind, Industrial Production may affect the trend, if data appear to be too positive. Probably, conservative traders had better wait for the data release. Yet, we don't rule out further “bullish” momentum after the fractal resistance is breached at 119.216: you may place a buy pending order there. Stop loss may be placed at 117.777, indicated most recently by Parabolic. This mark can be considered as a support line at the moment. After pending order activation, Stop loss is to be moved every four hours near the next fractal low, following Parabolic signals. Thus, we are changing the probable profit/loss ratio to the breakeven point. If the price meets Stop loss level without reaching the order, we recommend canceling the position: market sustains internal changes that were not considered.

Position Buy
Buy stop above 119,216
Stop loss below 117,777
Forum Jump  
  • You cannot post new topics in this forum.
  • You cannot reply to topics in this forum.
  • You cannot delete your posts in this forum.
  • You cannot edit your posts in this forum.
  • You cannot create polls in this forum.
  • You cannot vote in polls in this forum.