Entering into a fading or weakening trend is one of the most frustrating things a trader can encounter. Many traders have strategies for trend entry but if a trend has run its course and is weakening then it is of no use to you regardless of the entry set-ups.
Combining the Average Directional Index or ADX with a Trend Entry strategy can help you trade breakouts and pullbacks with higher probability.
The ADX is used to qualify and quantify trend strength. The approach and display is very simple. The ADX filter can have very beneficial effects on your trading results.
The indicator measures only strength but not directional bias. This allows the trader to choose the strongest trends to enter and let profits run when the trend is strong as per the ADX.
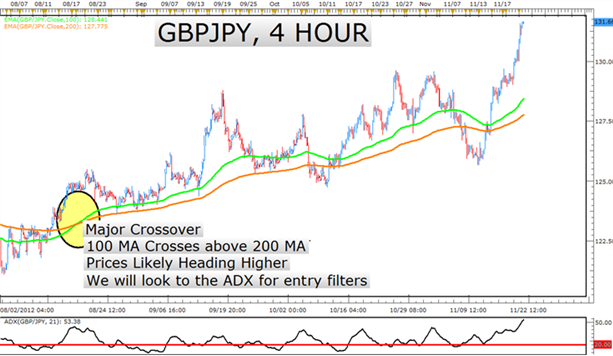
The GBPJPY shows an uptrend on the chart with multiple entries as the ADX indicator on the bottom shows a majority of readings above the strong trend level. The red line was added as a reference point of when the indicator shows a strong trend.
To filter the trend strength, we recommend looking for trend entries only when the ADX is above 25.
 ADX Rule
: When trading trends, the ADX rises when the trend is strong. When the trend is weak, ADX drops. This table will guide you through translating ADX values to trend strength.
ADX is not a directional indicator, only a Trend Strength identifier. Much like the RPM on a car doesn’t tell you the speed, only the force. ADX is the same behind the trend.
For directional bias, we recommend combining indicators to find pullbacks in the direction of the overall trend or breakouts with the ADX. This will combine higher probability set ups with a strengthening trend.
Entering Strong TrendsRule one for a lot of traders is that you can control the risk but not the market. Another rule is to only enter the higher probability set ups that match your trading profile. Using the ADX allows you to filter a current potential trade to see if the entry is worth the risk.
ADX is the filter we will use to determine whether a down move is worth entering on a sell trade. ADX will also be used in the same manner to grasp if an up move is worth entering on a buy trade. Either way the ADX will break through 25 to tell us that a strong trend is in play.
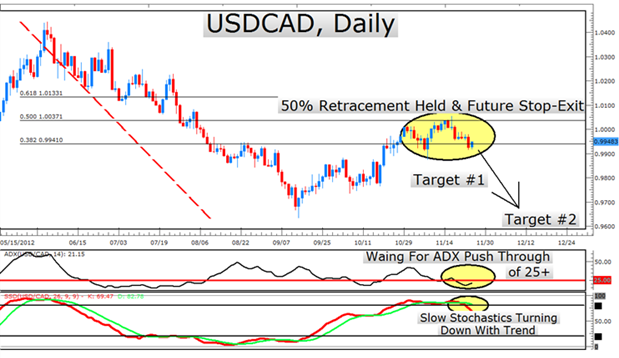
This current USDCAD set up shows us the beginnings of another potential strong down move.
Here are the tools at use on the chart above:
-ADX for filtering Trend Strength
-Fibonacci Retracement for support in a downtrend
-Stochastic for price turning back down from overbought levels
First and foremost, we will keep our eye on the ADX to push through 25. When the ADX breaks through 25, we have the indicator’s invitation to enter in the direction of the overall trend. The USDCAD overall trend on the daily chart is downward.
Because the ADX isn’t there yet, we’ll wait for the set up to develop.
Fibonacci retracements are a popular tool to identify potential levels with horizontal lines to indicate counter move exhaustion. In other words, support in a downtrend is potentially at one of these levels and when price bounces off these levels we can look to enter off that resistance point in a downtrend.
A favorite of many traders is the 50% level of any move. This 50% principle states that if a move, after all its variations in price, can hold the halfway level, there’s a good chance the overall trend will prevail. If the market cannot hold 50% of its move, then it may break down and reverse the overall trend.
We can see above that the market held the 50% level and is looking to move back down. If the ADX breaks through we have another confirmation.
The last indicator we will use is the slow stochastic oscillator (SSD). This momentum indicator compares a currencies closing price to its price range over a given time period in a range of 0-100. The 80 level shows an overbought reading and the 20 level shows an oversold reading. You can adjust the time period of the indicator to reduce the stochastic’s sensitivity to market movements.
During a downtrend, prices tend to close near their lows. Slow stochastic signals occur in a downtrend when the indicator turns down below 80 after a temporary upswing in the market. This shows higher probability entries.
These two indicators were added to the ADX to show you the flexibility allowed to the trader with this indicator. In the end, the ADX quantifies trend strength so you know if this is a trade worth entering based on your money management rules.
The ADX allows you to combine the indicators you are already comfortable with to ensure you’re only trading the strongest trends. This can keep you out of choppy markets when your objective is letting your profits run on a trend.
Happy Trading.
