Trading foreign exchange currency pairs is often considered an art rather than a science because it requires the use of experience and intuition to generate ongoing profits.
To become successful as a foreign exchange trader, you need to have an edge that enables you to make a consistent profit. An edge that will allow you to earn enough money when you are winning, and lose less than your winnings, when you end up losing money on a trade. Trading with confluence can give you the increased edge that you need to succeed in the foreign exchange market.
Firstly, let me take a moment to explain what confluence is. In a nutshell, confluence trading is simply combining more than one trading technique or analysis to increase your odds of winning on a trade.
For example, technical analysis is the study of using past price patterns to forecast future directional movement of a currency pair or any other underlying asset. Hence, if you use a single technical analysis tool which has, for instance, a 60 % accuracy rate of predicting the price movement, and then, apply a second, non-correlated technical analysis tool to filter your decision further, then you would be increasing your odds of winning. This is the basic idea behind trading Forex confluence.
And there are many ways a trader can apply the concept of confluence into their trading plan.
Trading Foreign Exchange with Technical Analysis ConfluenceA technical confluence occurs when you find a trade setup using multiple technical trading tools, and all of these independent forms of analysis indicate a similar impending directional price movement.
For example, when you are using an oscillating technical indicator like Stochastics, it can generate an overbought market condition signal near a major resistance zone. This resistance zone could happen to be a Big Round Number (BRN) as well. If you place a sell order based on these several technical factors, then you are essentially utilizing technical analysis confluence.
Confluence-Trading-Using-Stochastics-Indicator-Trend-Line-and-Support-Resistance-Levels
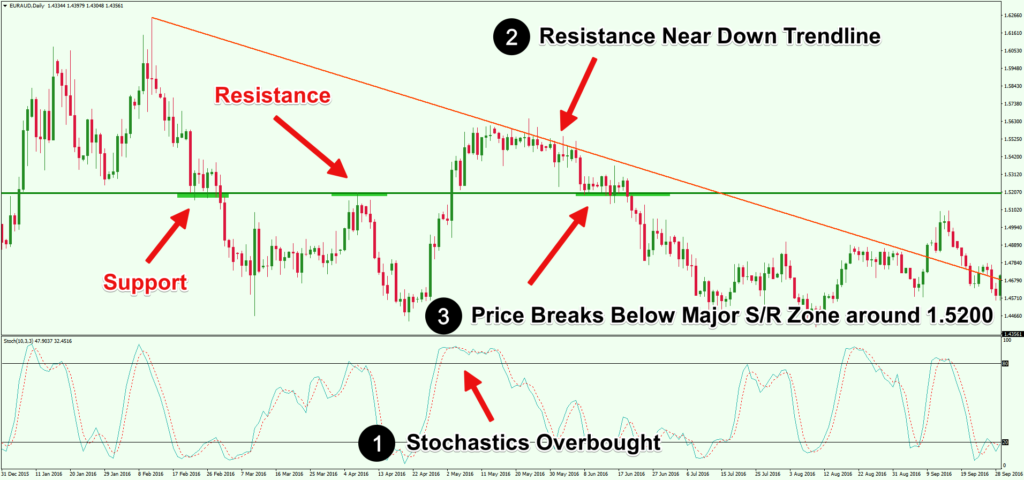
Figure 1: Confluence Trading Using Stochastics Indicator, Trend Line, and S/R Levels
This is the daily chart of the EURAUD forex pair. In this example, we can see that the Stochastics indicator was clearly trading above the 80 level (labelled number 1). Forex traders consider such market conditions as an indication of a possible overbought market. When the market is in an overbought market condition, it signals that the price could soon reverse the course of the prevailing trend or likely start a retracement move in the opposite direction.
Secondly, as soon as the EURAUD price reached the 1.5575 level, it formed a downtrend line (labelled number 2), where the price penetrated above the trend line several times, however, failed to close above it on the daily time frame. The formation of the downtrend line signaled the diminishing bullish momentum above this price level.
Next, you can see the EURAUD price respected the 1.5200 level as a major psychological pivot zone (labelled number 3), where the market previously found both support and resistance. Many professional forex traders consider price levels ending with round figures to act as important psychological levels, so this support and resistance level had special significance.
When there is price confluence at a support or resistance level, it often attracts large-scale institutional traders, market makers, and other participants who find these price levels opportune areas to place their pending orders. Thus, buyers and sellers engage in a sort of tug of war around these types of major confluence price levels.
The trade setup in figure 1 is showing a confluence on the price chart of three different technical factors – 1) a technical indicator signaling a possibility of an imminent change in trend, 2) formation of a downtrend line restricting the EURAUD price from moving upwards, and 3) a price squeeze favoring the downside, which also happens to be around a psychologically important big round number.
When the EURAUD price closed below the pivot zone around 1.5200 on June 15, 2016, it signaled a bearish move. If you had placed a sell order as soon as the price closed below the 1.5200 level, and kept your stop loss above the downtrend line, around 1.5415, then this particular trade could have yielded around 700 pips over the next two weeks.
Using-Technical-Analysis-Indicators-Find-Forex-Confluence
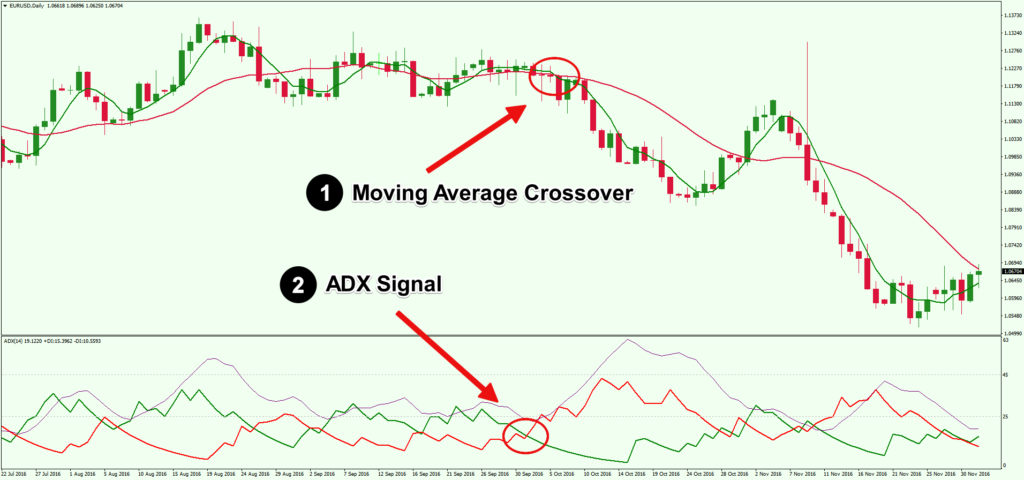
Figure 2: Using Different Technical Analysis Indicators to Find Forex Confluence
Let now look at the daily EURUSD chart in figure 2. Here we applied two different technical analysis indicators to identify a confluence: 1) a simple moving average (SMA) crossover of SMA (5) and SMA (21), and 2) the Average Directional Movement (ADX) indicator with default settings.
First, on October 2, 2016, the ADX (Average Directional Index) indicator (labelled number 1) generated a sell signal when -DI crossed above the +DI line. At this point, you could place a sell order based on that single factor. However, if you closely examine the previous few buy and sell signals generated by the ADX indicator, you can see that due to a range bound market condition, most of these signals did not result in any significant directional movement of price.
Hence, if you filter the ADX signal by using a trend analysis tool like a moving average crossover, it will likely increase the odds of catching an emerging trend.
Four days after the ADX signal, you will notice the SMA 5 crossed below the SMA 21 (labelled number 2). Within three days of the moving average crossover, the EURUSD started a downtrend that pushed the price lower by around 350 pips.
By applying confluence on the price chart, you could have entered the market at the right time and made a profit on this trade.
