Article Summary: A leading technical analyst of the 1930s created a method for trading that is still applicable today. Learn how to trade market turning points based on Fibonacci retracements and market psychology with the Gartley Pattern.
Many traders ask how a trading method that is 77 years old is applicable today. When you combine timeless tools like Fibonacci Retracements with common traits of successful traders, it’s easy to see why this method is so popular. If those aspects of a trading method appeal to you, it’s my pleasure to introduce you to the Gartley chart pattern.
What is the Gartley Pattern?The Gartley pattern is a powerful and multi-rule based trade set-up that takes advantage of exhaustion in the market and provides great risk: reward ratios. The pattern is also known as the “Gartley 222” because the pattern originated from page 222 of H.M. Gartley’s book, Profits in the Stock Market that was published in 1935 and reportedly sold for $1,500 at the time.
The Gartley pattern is based on major turning points or fractals in the market. This pattern plays on trend reversal exhaustion and can be applied to the time frame of your choosing. The other key that makes this pattern unique are the crucial Fibonacci retracements that come together to fulfill the plan.
There is a bullish / long / buying pattern and an equally powerful bearish / short / selling pattern. Much like you would find with a head and shoulders pattern you buy or sell based on the fulfillment of the set up.
Learn Forex: Buy & Sell Gartley Chart Pattern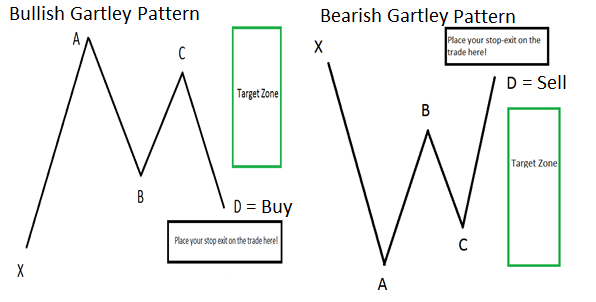
Here is a stripped down version of patterns so you can see what the look like without price and time on the chart.
The buy pattern will always look like an "M" with an elongated front let. The sell pattern will always look like a "W" with an elongated front leg.
Gartley Strategy ToolsThe three important tools to use on your chart when finding a Gartley are:
Fractals - The important part about trading the Gartley pattern is that you will trace the pattern from turning points or swings in the market. One of the better indicators to trace swings is Fractals. Fractals show up as arrow above swings in price.
Fibonacci Retracements – The Fibonacci retracements will make or break the patterns validity. Below are the specific retracements that make up the pattern. Fibonacci retracement lines are horizontal lines that display support or resistance in a move.
Add Line Tool (Optional) – This tool will allow you to clearly draw connecting points like X to A, A to B, B to C, and C to D for easy measuring.
Gartley Strategy Rules* Point B should retrace 0.618 from the XA move.
* Point D should retrace 0.786 from the XA move and create the entry zone.
* Point D should be a 1.27 or 1.618 extension of the BC move
* Point C should retrace anywhere from 0.382 – 0.886 of the AB move.
* Buy or Sell at point D depending on whether the pattern is bullish or bearish
* Place stop either below the entry for the tightest or Risk: reward ratio or below Point X.
* If the market trades through Point X, the Gartley pattern is invalid and you should exit or not take the trade.
When these rules are met, you can find yourself on the cusp of a trade at the Entry Zone. Recognizing these points in the market is truly like riding a bike. Once you get the hang of it, the levels will pop out on the chart to you.
The EURNZD set up an ideal Bearish Gartley Pattern leading into the Reserve Bank of New Zealand Interest Rate Announcement.
Learn Forex: EURNZD chart where Bearish Gartley played out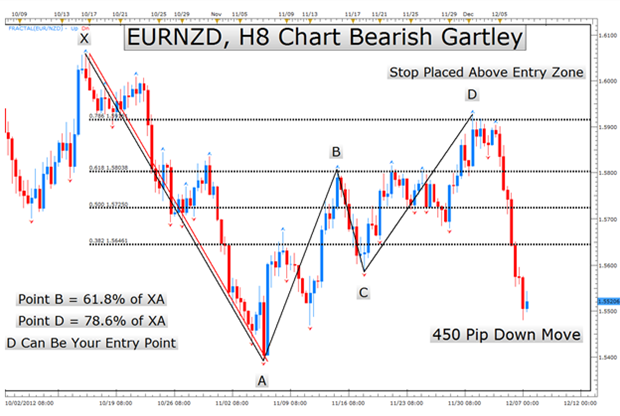
Another set up is forming on the EURJPY and has begun to play out. If you liked the set up, you could sell at Point D and place a stop above point X. Point X is the start of the pattern and is an extreme point on the chart.
Learn Forex: EURJPY chart where Bearish Gartley is forming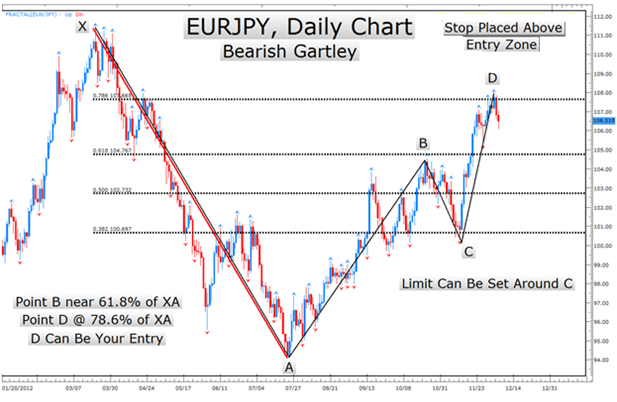 Closing Tips on Using This Pattern
When trading the Gartley pattern, the pattern is meant to be traded at D only. If you believe a pattern is unfolding but we’re only at point B, be patient and hold off until we get to D. The power of the pattern comes from converging Fibonacci levels of all points from X to D and using the completed pattern for well-defined risk.
Lastly, this can be traded on any time frame you prefer. The reason this method has a stable track record is that it is based on unusual market positions where most traders are afraid to enter. Take advantage of the risk: reward set up available and trade with proper trade size.
This pattern occurs rather frequently. When you get comfortable with using Fibonacci retracements for support and resistance you'll find yourself looking for the points to complete a Gartley pattern. It is very important to watch for the D point to be at 78.6% of the XA leg and to keep your stops rather tight in case the pattern is invalidated.
Happy Trading!
