Article Summary: Diagonal patterns are simple technical patterns that offer tight zones of entry and exit. Many times, the risk-to-reward ratio of the diagonal pattern will better than the 1-to-2 ratio that we suggest in our forex courses.
Diagonal patterns are one of my favorite patterns to trade because the method to trade them is fairly straight forward and you can identify clear risk and reward parameters. This piece will outline what a bullish diagonal looks like and how you set your entry and exit parameters for the potential trade.
The Anatomy of a Bullish Diagonal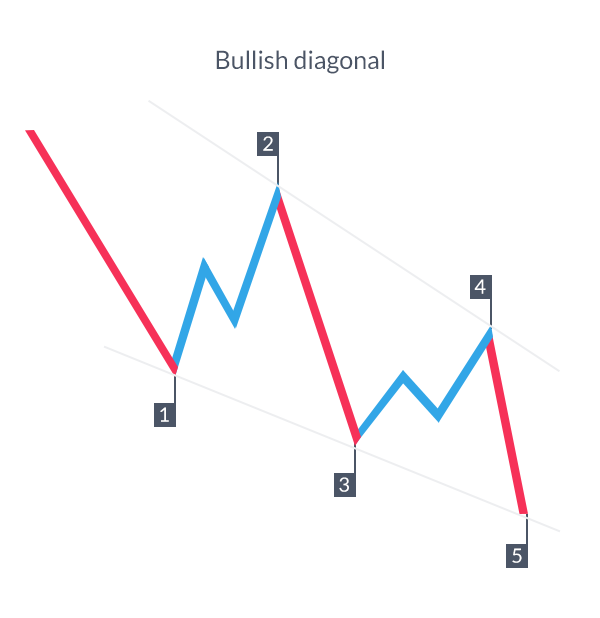
The ideal diagonal would consist of five waves. Each wave of the three waves to the downside would be smaller than the previous alternating wave. The alternating waves of the 5 wave move are waves 1, 3, and 5.
For example, wave 5 would be smaller in length than wave 3. Wave 3 would be smaller in length than wave 1. So wave 3 would be smaller in length than wave 1.
When you connect waves 2 and 4 with a trend line and connect waves 1 and 3 with a trend line, then you will notice a triangular type of drawing (see grey lines). This becomes the basis of the bullish diagonal pattern.
This pattern tends to fool trend traders because it continues to produce lower highs and lower lows. Trend traders would see this as a bearish trend. However, there are a couple of clues that can tip us off that the trend is likely to correct or possibly reverse.
1. Measure the waves – In the idealized pattern above, see how wave 5 is shorter than wave 3 while wave 3 is shorter than wave 1. This indicates the trend lower doesn’t have the strength it used to. Each subsequent push lower in price travels less distance than the previous leg. The trend has moved too far and too fast to the downside and is likely to correct upward.
2. Look for simple indicator divergence – determine if divergence is showing up in the formation of wave 5. Divergence is another clue of a tiring trend and momentum is slowing to the downside. Absent a healthy correction to the upside, this pattern is losing momentum and at risk of a sharp move up.
Another key point to consider is distinguishing the difference between an ending diagonal and a triangle. Triangles tend to move sideways as they consolidate a prior move. Diagonals tend to be directional.
For example, see how both grey lines in the idealized chart above are both pointed down? This is what I mean by both lines are directional. You’ll see both trend lines point in the same direction in a diagonal. A triangle will see both trend lines pointed in different directions.
Learn Forex: Ending Diagonal Trade Set Up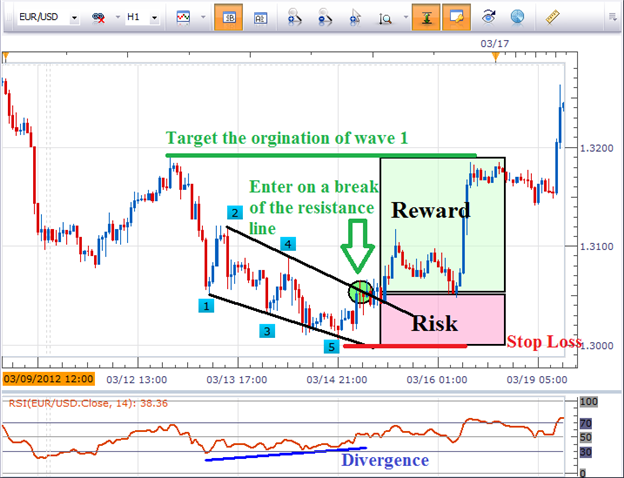
As you can see in the above example, prices in the EURUSD were towards the end of an exhaustive move to the downside. Prices kept pushing lower and creating lower highs and lower lows. Trend traders may see that type of price action and jump into the trend to the downside. However, the length of wave 5 is less than the length of wave 3, and the length of wave 3 is smaller than wave 1 tipping us off that the trend is certainly slowing. Additionally, the RSI oscillator is flashing divergence as price reaches lower lows yet the oscillator fails to confirm lower lows.
Trading the DiagonalAs wave 5 is taking shape or shortly after it is completed, we can begin setting up our trade.
1. Draw a trend line connecting the top of wave 2 and the top of wave 4
2. Enter on a break above this trend line as a break indicates a high probability the low of wave 5 is in place
3. Place your stop loss just below the swing low of wave 5
4. Place your limit to take profit at the beginning of wave 1
Many times, because the pattern is losing momentum to the downside, when prices finally turn bullish, it can be a swift correction to the upside.
As you can see from the chart above, the risk-to-reward ratio on this trade would have been about 1-to-3 which is many times better than the 1-to-2 risk-to-reward ratio we discuss in our DailyFX Education courses.
Remember, this is simply a pattern to follow with buy and sell rules. Not all patterns and not all trades work out to be a winning trade. Therefore, it is important to be responsible to your account and use prudent risk management techniques such as trading in small sizes risking a small portion of your account. We suggest risking less than 5% of your account on ALL open trades.
Good luck with your trading!
