The first thing to remember when using an indicator, any indicator, is that it is a function of price action. The indicator itself is not the ultimate tool when it comes to trading…it comes in behind price action. Price action governs the information that the indicator will ultimately provide on the chart.
Price action is Indicator #1.
As such, a trader must determine what price action is doing (i.e. the trend) before consulting the indicator for an entry signal. Once the trend is determined, the trader can then consult the indicator for an entry signal in the direction of the trend.
Now, let’s take a look at the 1 hour chart of the EURGBP below…
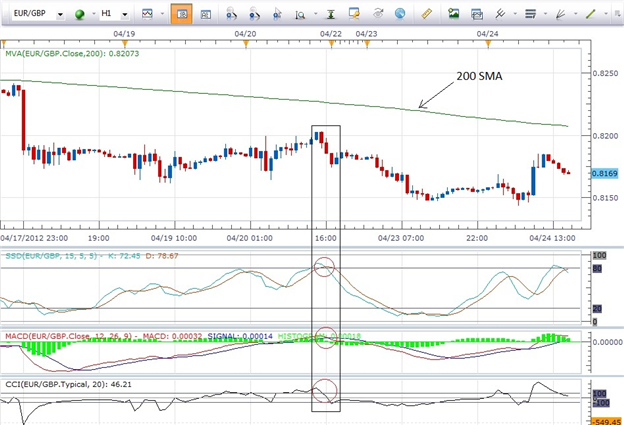
First of all we note that the currency pair is in a downtrend. We know this because on longer time frames, the Daily and the 4 hour, the pair has been making lower highs and lower lows which signify a downtrend. Also, on each of the charts, the pair is trading below the 200 SMA. Lastly, when we do a Strong/Weak analysis, we find that the EUR is weak and the GBP is strong. Given each of those pieces of information, we know we want to sell the pair since that is the direction of the trend and that will be the higher probability trade.
Now, let’s take a look at the indicators on the chart.
The three indicators that we have on the chart are oscillators…Slow Stochastics, MACD and CCI. In a downtrend, the entry signals for a sell from each indicator are as follows: Stochastics – when the K line (blue) crosses over the D line (red) to the downside; MACD – when the MACD line (red) crosses over the Signal line (blue) to the downside; and, CCI – when the CCI line crosses below +100.
As can be seen on the chart, each of the indicators provides a sell signal at virtually the same time. So, given that, which one of the three is the “best”? In my opinion, in this key area they are all the same. They all provide the same signal at the same time. The choice will depend on the one that each individual prefers.
As in the case of so many things in trading, there are no absolutes.
To determine which is the best one for you, we recommend that traders simply try all three individually over the course of many trades (100+) before they decide…kind of like test driving a car before you buy. Once you make your decision on which you like the best, stick with that one and discard the other two. Having all three on a single chart would be redundant.
