Article Summary: When studying how to place trades in the direction of the trend many traders focus on the four most common indicators used by technical traders. However, by adding Fibonacci to your trading, not only can you locate future targets for stops and exits but you can also find triggers to improve your forex trading results in as little as two steps.
Every trader wants to find high probability set-ups. Naturally, we feel that trading in the direction of the overall trend is the best way to put the odds of success in your favor. Beyond trading in the direction of the dominant trend there are a few tools that you can use to help you find specific entry and exit targets.
What Are Fibonacci Numbers?In short, Fibonacci numbers or ratios are mathematically significant numbers that occur throughout nature and often in financial markets. They were discovered by Leonardo de Pisa in the 13th century and he was known as the most talented Mathematician in the middle ages. The most important number or ratio is the 61.8% or .618 levels. There is also a 1.618 Extension along with 2.618. In Forex trading, Fibonacci retracements can identify potential support / resistance levels.
Learn Forex: Important Fibonacci Levels Applied to EURUSD to Find Support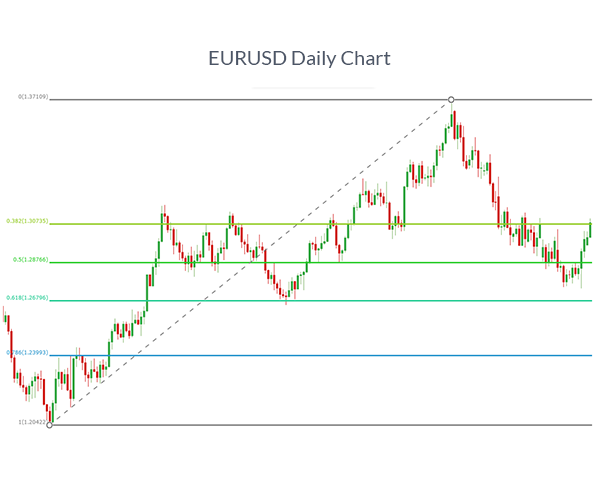
From a trading perspective, the most commonly used Fibonacci levels are the 38.2%, 50%, 61.8% and sometimes 23.6% and 76.4%. In a strong trend, which we always want to be trading, a minimum retracement is around 38.2%; while in a weaker trend, the retracements can be 61.8% or even 76.4%. A complete retracement or break of 100% of the prior move would nullify the current move.
How Should I draw The Fibonacci Retracement Trend Line?The most important thing to know is that the base of the trendline should be drawn from left to right. If there is a bullish trend and you’re currently noticing a retracement to the downside then you’d want to look for support at one of the levels appearing on the chart like we see above on EURUSD. If there is currently a bearish (down) trend and a retracement is taking shape then you’d want to look for resistance.
Learn Forex: Important Fibonacci Levels Applied to GBPUSD (Looking For Resistance)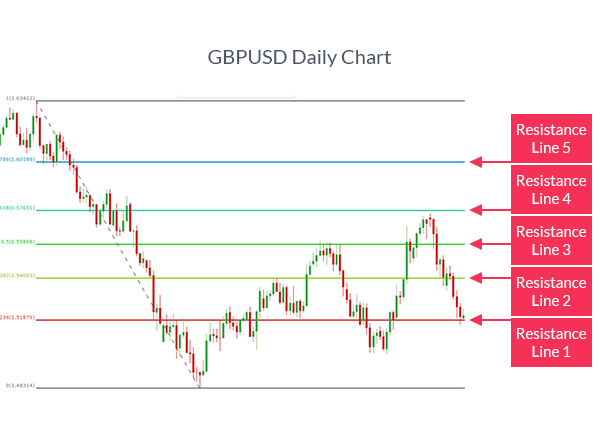
An important note about using any trading methodology is that neither you nor I can guess with perfect accuracy a future move. So the next best thing is to watch closely levels of support and resistance. Once you notice a strong move off of support in an uptrend or resistance in a downtrend then you can use further levels of resistance as price targets.
Two Methods Of Using Fibonacci To Find Likely Price TargetsThe two methods we’ll address in this article with Fibonacci are using the Fibonacci Retracement levels in the direction of the prevailing trend and using either Fibonacci Retracement / Extensions as targets or Fibonacci Expansion Tool. As a refresher, the prevailing trend is the one you’re using to draw the Fibonacci line from. Therefore, in a prevalent downtrend, because you drew from left to right and top to bottom, you are looking for resistance being honored and move back to the downside.
LEARN FOREX: AUDUSD Shows How You Can Use Retracements As Price Targets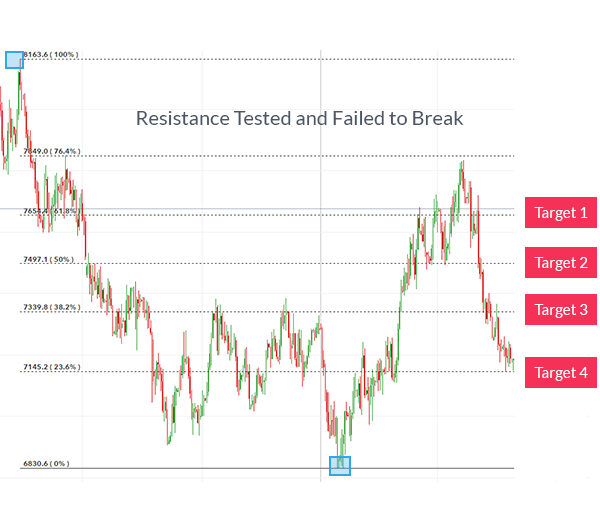 Fibonacci Projection Rules
First and foremost, you want to focus on trading in the direction of the trend of the chart you are trading on. The weekly trend may vary from the trend on the 4 hour chart, but if you’re trading on the 4 hour chart than that is the trend you should be focusing on.
Fibonacci Price ExtensionsAn easy way to think of Fibonacci extensions vs. retracements is that extensions go beyond 100% with the same tool used to find retracement levels. To find an extension level on a new downtrend you would run the low to high extension for possible support. Reversely, on a new uptrend, you would run the high to low extensions for possible resistance that can act as profit targets. The levels most commonly used are the 1.00%, 1.272%, 1.618%, 2.00% or 2.618%.
LEARN FOREX: Fibonacci Extensions Look Beyond the 100% Level For Price Targets – AUDUSD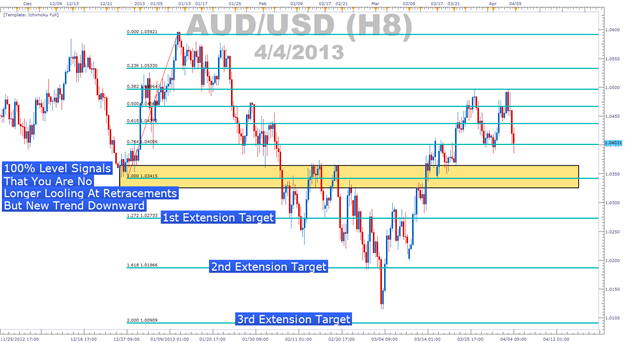 Fibonacci Expansions or Price Objectives Is Your Third Tool Option
Expansions or Price Objectives are different than Extensions even though they sound similar. The main variation is that you’re now using three key pivots in the market to find your target level. For potential resistance or buy targets, you would draw from a major low to a major high back to a major low to get resistance. For potential support or selling targets you would draw from a major high to major low back to another major high from left to right.
In summary, if you’re using two points alone, you’re using retracements or extensions. If you’re using three points for your target, then you’re using expansion or price objectives. The common levels used for expansions are 0.618, 1.00, and 1.618.
LEARN FOREX: Fibonacci Expansions Looks To Each Level As Next Possible Target – AUDUSD & GBPUSD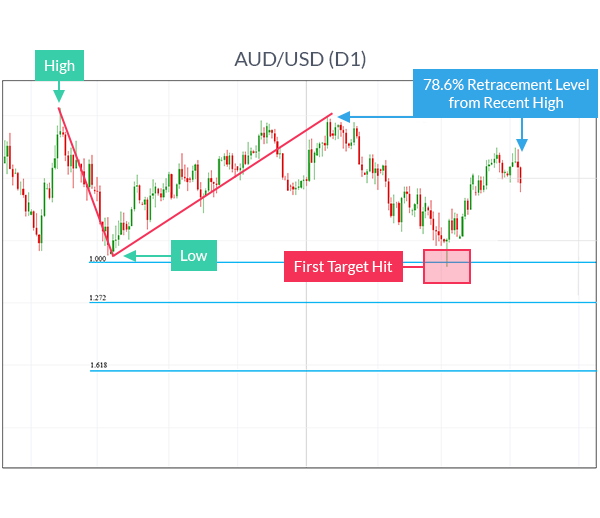 Closing Thoughts
Fibonacci Expansions and Extensions can be great leading indicator of price targets once a Retracement level is honored. Deciding which tool to use is a personal choice for price targets as both methods have their benefits. Because this tool is taking you into new price territory, trailing stops are recommended along with the proper trade size so that your risk is always contained.
Happy Trading!
