LandOfCash Forex expert advisors, Trailing EA, Indicators.

Forex Trading Expert Advisors (EA or automated trading system) and Custom Indicators (CI) for MetaTrader Platform.

LOCTrailing With Partial Close Expert Advisor protect your orders profit. Trail stop level for manual and automatic orders with different algorithms, move stop loss into breakeven.

LOCInfo Custom Indicator follow the simple rules and make the right decision when to buy or sell. View Moving Average, Stochastic indicators from multiple time frames in one place.

riki143
  • Posts: 1104
  • Joined: 15/08/2017
USD/JPY Daily Analytics
11:19 25.01.2018

UserPostedImage

There's still no any reversal pattern so far, which means the price is likely going to continue declining towards the lower "Window". If any bullish pattern forms little later on, there'll be a moment to have an upward correction

UserPostedImage

We've got a bearish "Engulfing", but this pattern hasn't been confirmed yet. So, there's an opportunity to have a local bearish correction in the coming hours. Nevertheless, bears are likely going to test the next support area afterwards.

More:
https://fbs.com/analytics/articles/usd-jpy-bearish-engulfing-6458?utm_source=forum&utm_medium=affiliate&utm_campaign=EN_English&utm_content=Riki_Analytics 
riki143
  • Posts: 1104
  • Joined: 15/08/2017
WHY THE DOLLAR FELL SO LOW?
11:29 25.01.2018
We are seeing the fall of the US dollar since the end of December 2017, but US Treasury secretaries preferred to say little about it until this Wednesday.

The US made the biggest fall since December 2014 when the Treasury Secretary Steven Mnuchin claimed on Wednesday that “a weaker dollar is good for us as it relates to trade”. The Secretary made his comment in Davos, Switzerland during the World Economic Forum, where a lot of people are waiting for the Donald Trump’s address

What did he really say? Mnuchin said that a cheaper dollar increases export demand. And he is right. Mnuchin claimed that the US wants fair economic competition and reciprocal trade. Tax cuts make the US more attractive for investments. He believes that where the dollar is in short-term reflects a very liquid market, but the long-term level will support the strength of the economy.

However, despite positive comments about the US policy, the market reacted to the confirmation of dollar weakness and the dollar fell losing 0.8% against the Euro.

UserPostedImage

But we cannot say that Mnuchin’s words were crucial for the USD. We should not forget that overseas economic growth and shifting perceptions of monetary policy have been causing the dollar weakness as well. So the fall was expected but maybe not at such rate.

Summing up the Secretary’s statement, we can suppose that the US will not act to strengthen the dollar now. However, it is important to remember that depreciation adds pressure on inflation. So the Fed will have to take it under control. But if inflation rises, the Fed will have to tighten its monetary policy and it will change the US dollar rate.

More:
https://fbs.com/analytics/articles/why-the-dollar-fell-so-low-6459?utm_source=forum&utm_medium=affiliate&utm_campaign=EN_English&utm_content=Riki_Analytics 
riki143
  • Posts: 1104
  • Joined: 15/08/2017
AUD/USD Daily Analytics
07:00 14.02.2018
Technical levels: support – 0.7750, 0.7815; resistance – 0.7880

Trade recommendations:

Sell — 0.7870/80; SL — 0.7900; TP1 — 0.7815; TP2 — 0.7750.
Reason: bearish Ichimoku Cloud with rising Senkou Span A; a golden cross of Tenkan-sen and Kijun-sen; the market returned to bottom border of the Cloud.

UserPostedImage

More:
https://fbs.com/analytics/articles/aud-usd-aussie-has-grown-to-cloud-6797?utm_source=forum&utm_medium=affiliate&utm_campaign=EN_English&utm_content=Riki_Analytics 
riki143
  • Posts: 1104
  • Joined: 15/08/2017
USD/CHF Daily Analytics
07:25 14.02.2018
Recommendations:

BUY 0.9465 SL 0.941 TP 0.955 TP2 0.9655

SELL 0.926 SL 0.9315 TP1 0.916 TP2 0.906 TP3 0.9015

On the daily chart of USD/CHF, the inability of bulls to keep the pair above 0.9410 points at their weakness. Return to correction low at 0.9465 will allow us to talk about the “Head and Shoulders” pattern. To continue the decline the pair has to break below January low.

UserPostedImage

On H1, USD/CHF is forming “Spike and ledge” and “Bat”. To continue the decline, bears need to pull the dollar below support at 0.93 and 0.9280.

UserPostedImage

More:
https://fbs.com/analytics/articles/usd-chf-franc-aims-on-a-record-6799 
riki143
  • Posts: 1104
  • Joined: 15/08/2017
GBP/USD Daily Analytics
07:33 14.02.2018
Recommendations:

SELL 1.415 SL 1.4205 TP1 1.405 TP2 1.3950

SELL 1.3795 SL 1.3850 TP1 1.3695 TP2 1.3560

On the daily chart, GBP/USD bulls managed to defend the important level of 1.3830 and want to consolidate in the 1.3800-1.4150 area. If the pair renews February low, the risks of it going to 88.6% target of the “Bat” pattern will increase.

UserPostedImage

On H1, GBP/USD bulls try to form “Wolfe waves”. If they manage to do it, the pound may rise to the upper border of the descending channel at $1.41-1.4150. The pullback to the downside will be a selling signal.

UserPostedImage

More:
https://fbs.com/analytics/articles/gbp-usd-pound-got-in-the-corner-6800 
riki143
  • Posts: 1104
  • Joined: 15/08/2017
THE US DOLLAR WEAKNESS AHEAD OF CPI DATA
08:37 14.02.2018
Today we expect the CPI and Retail Sales data at 15:30 MT time. If we look at charts, the greenback is depreciating against all currencies.

Why is it happening with the US dollar and what should we expect from the inflation data?

Let’s look at some forecasts.

Nomura predicts the deceleration of the core inflation in January. They declare monthly core CPI at 0.2% compared to the December one of 0.3%. Such reduction will lead to the annual core CPI decrease by 0.1 percentage point from 1.8% in December to 1.7% in January. Talking about the headline CPI data, they expect an increase from 0.1% to 0.4% in monthly figures and the rise of the annual to 2.0%. Such growth is based on higher gasoline prices and firm growth of food prices.

RBC has almost the same forecast as Nomura about the core and headline CPI. Moreover, RBC does not anticipate any real momentum until the second quarter of 2018. They expect that negative effects from the last year will roll off the year calculation only by that time. The annual headline inflation will be able to come closer to 3% in the third quarter.

The forecast of Barclay does not differ from the previous ones a lot. They expect the monthly core level to be at 0.2% and the annual one at 1.6%. The monthly headline inflation will increase by 0.4%, the annual by 1.9%.

The average forecast of the main economic experts declares the slight decrease of the monthly data of the core CPI growth from 0.3% to 0.2%. The headline CPI is anticipated to rise by 0.2 percentage points (0.1% to 0.3%) m/m.

Let’s sum up.

The rise of inflation is important for the US dollar. If the CPI is higher, it is more likely that the Fed will raise interest rates. An increase of the interest rates always leads to the strengthening of a domestic currency, so the greenback will have chances to strengthen its positions.

But the data is mixed, we expect the fall of the core CPI growth and the rise of the headline CPI at the same time. However, we can say that the forecasts are not negative. The fall is just by 0.1 percentage points. The annual headline CPI forecast is still below 2%, but not too much lower.

So why the dollar is weakening a lot?

The reason can be hidden in the lack of beliefs in the strong dollar. The market is used to the weak greenback, that is why every negative data can cause its further fall. Another reason is the strengthening of the global equity markets after the great selloff. Furthermore, US 10-year yields are now down to lows on the day, as Treasuries are more bid on the day.

So the greenback cannot find a support in any way.

More:
https://fbs.com/analytics/articles/the-us-dollar-weakness-ahead-of-cpi-data-6802 
riki143
  • Posts: 1104
  • Joined: 15/08/2017
EUR/USD Daily Analytics
10:17 14.02.2018

UserPostedImage

The main trend is still bullish. Also, there's a "Triple Bottom" pattern, which has been confirmed. So, the market is likely going to test the nearest resistance at 1.2405 - 1.2434 in the short term.

UserPostedImage

There's a confirmed "Double Top" pattern, so the market is likely going to reach the 89 Moving Average in the coming hours. If a pullback from this line happens little later on, there'll be an opportunity to have another upward price movement.

More:
https://fbs.com/analytics/articles/eur-usd-triple-bottom-pattern-6804 
riki143
  • Posts: 1104
  • Joined: 15/08/2017
GBP/USD Daily analytics
10:19 14.02.2018

UserPostedImage

There's a bearish "Pennant", so the pair is likely going to achieve the nearest support at 1.3741. Meanwhile, if a pullback from this level happens afterwards, bulls will probably try to reach the next resistance at 1.3895 - 1.3944.

UserPostedImage

The market is consolidating between the Moving Averages. The main intraday target is the closest support at 1.3763 - 1.3741. This area could be a departure point for a bullish price movement in the direction of another resistance at 1.3895 - 1.3944.

More:
https://fbs.com/analytics/articles/gbp-usd-bearish-pennant-6805 
riki143
  • Posts: 1104
  • Joined: 15/08/2017
DOES THE VALENTINE’S DAY REALLY AFFECT THE FOREX MARKET?
10:41 14.02.2018
The Valentine’s Day is one of the days during a year that brings the biggest amount of money to an economy.

An interesting fact is that for this holiday people buy presents not only for their lovers but for families and friends as well. That is why consumer spending increases a lot. This year US consumers are expected to contribute to the economy nearly $19.6 billion, even more than last year record of $18.6. It is an important indicator because consumer spending is the largest part of GDP, it contains nearly 70% of the output.

Valentine’s Day has an influence on markets as well. The five best-selling gifts are candy, greeting cards, evening out, flowers and jewelry. It means that these industries will be more volatile before and during the February 14. Prices and demand significantly increase in these markets. For example, Japanese chocolate industry gets more than half of its $5 billion in annual sales on Valentine’s Day. Countries, where these industries are more developed, will get the higher profit on the holiday. These profits will contribute to retail sales and consumer spending data for February.

At the same time, if we look at the dynamics of stock indexes during the Valentine day itself, the picture will not be as rosy. It turns out that since 1928 the S&P 500 has closed up on just 40% of Valentine’s Days. The Dow Jones Industrial Average has risen on 14 February just 43% of the time. Maybe it’s a coincidence, but maybe traders just more eager to spend time with their loved ones than to buy stocks. Or maybe this time stocks will get luckier?

Making a conclusion, we can say that the Valentine’s Day has an impact on markets and Forex market as well. The huge money contribution has a positive influence on a domestic economy. Countries with more developed industries, that are popular on Valentine’s Day, have higher profit. This effect will have a medium-term impact on the market. However, stock markets depreciate on the day of love.

More:
https://fbs.com/analytics/articles/does-the-valentine%E2%80%99s-day-really-affect-the-forex-market-6811 
riki143
  • Posts: 1104
  • Joined: 15/08/2017
EUR/JPY Daily Analytics
06:51 15.02.2018
Recommendation:

BUY 133.40

SL 132.85

TP1 134.40 TP2 135.40

On the daily chart, EUR/JPY reached 88.6% target of a “Shark” pattern. As a result, risks of a pullback increased. A pin bar increases the risks of a correction. Its high forms resistance at 133.40. To continue the decline to 113% target of the “Shark” patterns, bears need to pull the euro to February low.

UserPostedImage

On H1, EUR/JPY formed two bars with lower bottom wicks. It means that bulls are ready to counterattack. They want to trigger a “Shark” pattern with a target of 88.6%.

UserPostedImage

More:
https://fbs.com/analytics/articles/eur-jpy-euro-is-grabbing-for-a-pin-bar-6831?utm_source=forum&utm_medium=affiliate&utm_campaign=EN_English&utm_content=Riki_Analytics 
riki143
  • Posts: 1104
  • Joined: 15/08/2017
USD/JPY Daily analytics
07:00 15.02.2018
Recommendation:

SELL 107.40 SL 107.95 TP1 106.40 TP2 105.35 TP3 102.80

SELL 108.05 SL 108.60 TP1 107.00 TP2 106.4 TP3 105.35

On the daily chart, USD/JPY bears managed to lead the pair out of the long-term consolidation range of 107.35-115.35. As a result, it triggered AB=CD pattern with targets at 127.2% and 161.8%.

UserPostedImage

On the daily chart, bears are in total control of the pair. In such conditions, pullbacks should be used for selling. The nearest resistance levels are at 107.30-107.45, 107.90-108.05 and 108.40-108.50.

UserPostedImage

More:
https://fbs.com/analytics/articles/usd-jpy-yen-crashes-obstacles-6832?utm_source=forum&utm_medium=affiliate&utm_campaign=EN_English&utm_content=Riki_Analytics 
riki143
  • Posts: 1104
  • Joined: 15/08/2017
CAN BITCOIN RETURN TO UPTREND?
10:03 15.02.2018
A lot has happened to Bitcoin since the start of 2018. The recent weeks haven’t been easy for the cryptocurrency: BTC/USD fell to $6,000 on February 6. Since then, some recovery took place. Yet, the highs of 2017 in the $20K area remain far away. Some people argue that Bitcoin will go “to the moon” (i.e. higher than we can imagine today), while others consider it a bubble and expect more declines. Who is right?

To begin with, Bitcoin’s selloff in January and February is not unusual. There were periods in 2012, 2013 and 2017 when the market fell by 30% and more during 1 or several days. The recent move simply looks more impressive because it was preceded by a spectacular advance.

Now some analysts say that after this healthy correction the market has become more mature and may attract more serious investors. JP Morgan said that cryptocurrencies may represent instruments to diversify portfolios from holding traditional stocks and bonds. Many new players may join the cryptocurrency market when the price makes pullbacks to the downside. In addition, there are so-called HODL investors – people who will hold Bitcoins no matter how low the price gets. Bitcoin futures have provided a way for Wall Street to trade this dynamic market.

Good things and bad things for Bitcoin
It’s clear that for a significant rebound in Bitcoin the market’s sentiment should improve. The majority of traders should believe that the negative factors affecting the price are only temporary.

We can say that the situation starts improving. The price remains influenced by regulatory activity in major trading markets and here there are some bright things.

South Korea, which has previously crashed BTC by considering a cryptocurrency ban, now says that it will focus on making cryptocurrency trading transparent and that it was never seriously planning to shut down crypto exchanges.

US regulators – SEC and CFTC – admitted the underlying value of cryptocurrencies. According to them, the basis for Bitcoin’s value is miners’ costs. The UK launched the not-for-profit and membership-driven organization to regulate cryptocurrency trading.

Big banks have indicated that they are interested in the cryptocurrency market. For example, Goldman Sachs is creating an interface for cryptocurrency trading. JP Morgan also considers integrating blockchain into its systems.

Yet, the environment for cryptocurrencies remains difficult. The problem is that, for now, it seems quite easy for big players and decision-makers to destabilize the market. The rapidly moving price attracts a lot of predators who practice different kinds of manipulations, for example, fake news. The infrastructure for trading is far from perfect. Hack attacks, thefts, and hidden mining happen quite often.

Bitcoin price forecasts
The main resistance level for BTC/USD is located at $12K. If it manages to rise above this level, the correction would be over and the price will get a chance to rise to $14-17K. The inability to break above $12,000 would be a longer period of sideways trading for cryptocurrencies.

UserPostedImage

Analysts at Bloomberg think that BCT should return down to $900 because it’s the average price level since the creation. This looks like a big decline given rather high demand, but given the extreme volatility of the market, this is far from impossible.

Yet, it looks more likely that Bitcoin is at the beginning rather than at an end. A lot of things have happened and there will be more: technological breakthroughs, changes in regulation and market sentiment. Bitcoin can actually face several more years of turbulence before the token stabilizes as a legitimate commodity.

There are a lot of predictions that BTC will rise to $20,000-$50,000 in 2018. Much depends on the success of the Lightning Network, a technological improvement that’s expected to unfold this year and make Bitcoin transactions faster and cheaper.

If we need to answer a question whether Bitcoin can resume uptrend, the answer is yes. To make sure that things go that way watch for news and important technical levels and remember that the one thing we can be 100% sure of is that there will be many more big swings on the way.

More:
https://fbs.com/analytics/articles/can-bitcoin-return-to-uptrend-6834 
riki143
  • Posts: 1104
  • Joined: 15/08/2017
EUR/USD Daily analytics
13:10 15.02.2018

UserPostedImage

The main trend is still bullish, so the market is likely going to reach the next resistance at 1.2537 - 1.2569. If a pullback from this area happens little later on, there'll be an opportunity to have a decline towards the closest support at 1.2453 - 1.2434

UserPostedImage

Bulls faced with resistance at 1.2522, so the pair is likely going to test the closest support at 1.2474 - 1.2453. This area could be a departure point for another upward price movement in the direction of the next resistance at 1.2522 - 1.2537.

More:
https://fbs.com/analytics/articles/eur-usd-pair-going-to-reach-next-resistance-6835 
riki143
  • Posts: 1104
  • Joined: 15/08/2017
GBP/USD Daily analytics
13:15 15.02.2018

UserPostedImage

The last "Double Bottom" pattern led to the current upward price movement. The main intraday target is the next resistance at 1.4149. Meanwhile, if we see a pullback from this area, there'll be a moment to have a downward correction.

UserPostedImage

Bulls have broken the last "Pennant" pattern, so the price is rising. It's likely to have a local bearish correction in the coming hours, but the market is likely going to test the nearest resistance at 1.4066 - 1.4100 afterwards.

More:
https://fbs.com/analytics/articles/gbp-usd-double-bottom-pattern-6836 

riki143
  • Posts: 1104
  • Joined: 15/08/2017
EUR/USD Daily analytics
13:22 15.02.2018

UserPostedImage

The last bullish "Harami" and "Engulfing" patterns led to the current upward price movement. If any bearish pattern forms in the short term, there'll be a moment for a bearish correction.

UserPostedImage

The nearest "Window" acted as support, so there's a "Three Methods" pattern. In this case, the market is likely going to continue moving up in the coming hours.

More:
https://fbs.com/analytics/articles/eur-usd-three-methods-pattern-6837 
riki143
  • Posts: 1104
  • Joined: 15/08/2017
USD/JPY Daily analytics
13:30 15.02.2018

UserPostedImage

The last "Three Methods" pattern led to the current decline. There's no any reversal pattern so far, which means the pair is going to continue declining.

UserPostedImage

There's no any reversal pattern, but we could have a bullish correction. If the 34 Moving Average acts as resistance, there'll be an opportunity to have another bearish price movement.

More:
https://fbs.com/analytics/articles/usd-jpy-no-any-reversal-pattern-6838 
riki143
  • Posts: 1104
  • Joined: 15/08/2017
USD/CHF Daily Analytics
16:06 15.02.2018
USD/CHF broke pivotal support level 0.9250
Next sell target - 0.9450
USD/CHF continues to fall after the earlier breakout of the pivotal support level 0.9250 (low of the previous sharp intermediate impulse wave (3) from the start of February). The breakout of the support level 0.9250 continues the active intermediate impulse wave (5), which started earlier with the daily Bearish Engulfing from the resistance level 0.9450 (former multi-month support level from July and September).

UserPostedImage

More:
https://fbs.com/analytics/articles/usd-chf-broke-pivotal-support-level-09250-6841?utm_source=forum&utm_medium=affiliate&utm_campaign=EN_English&utm_content=Riki_Analytics 
riki143
  • Posts: 1104
  • Joined: 15/08/2017
GBP/USD Daily Analytics
16:08 15.02.2018
GBP/USD reversed from support zone
Next buy target - 1.4200
GBP/USD previously reversed up from the support zone lying between the strong support level 1.3800, lower daily Bollinger Band and the 50% Fibonacci correction of the previous sharp upward impulse from the middle of December. The upward reversal from this support zone started the active minor impulse wave 3. GBP/USD is expected to rise further toward the next buy target at the next resistance level 1.4200 (resistance trendline of the daily up channel from August).

UserPostedImage

More:
https://fbs.com/analytics/articles/gbp-usd-reversed-from-support-zone-6842?utm_source=forum&utm_medium=affiliate&utm_campaign=EN_English&utm_content=Riki_Analytics 
riki143
  • Posts: 1104
  • Joined: 15/08/2017
EUR/USD Daily Aalytics
06:20 19.02.2018
Technical levels: support – 1.2380; resistance – 1.2470, 1.2520.

Trade recommendations:

Buy — 1.2380; SL — 1.2360; TP1 — 1.2470; TP2 — 1.2520
Reason: bullish Ichimoku Cloud with horizontal Senkou Span A and B; a golden cross of Tenkan-sen and Kijun-sen, but the lines are horizontal; the prices are returned to the support of the Kijun-sen.

UserPostedImage

More:
https://goo.gl/cp12WT 
riki143
  • Posts: 1104
  • Joined: 15/08/2017
GBP/USD Daily Analytics
06:21 19.02.2018
Technical levels: support – 1.3980; resistance – 1.4100, 1.4170.

Trade recommendations:

Buy — 1.3980; SL — 1.3960; TP1 — 1.4100; TP2 — 1.4170.
Reason: narrow bearish Ichimoku Cloud with horizontal Senkou Span A and B; a golden cross of Tenkan-sen and Kijun-sen, but the lines are horizontal; the prices are entered into the cloudy area and will may test the Kijun’s support.

UserPostedImage

More:
https://goo.gl/bVxFJ9 
riki143
  • Posts: 1104
  • Joined: 15/08/2017
NZD/USD Daily Analytics
07:21 19.02.2018
Recommendations:

BUY 0.7475 SL 0.7420 TP1 0.7575 TP2 0.7675 TP3 0.7775

SELL 0.7365 SL 0.7420 TP1 0.7275 TP2 0.7235 TP3 0.7205

On the daily chart of NZD/USD, if bulls manage to settle above 0,7395 and then overcome resistance at 0.7475, the formation of the “Widening wedge” will allow them to count on the resumption of an uptrend.

UserPostedImage

On H1, NZD/USD reached the targets of “Wolfe waves” pattern. The pair’s currently forming a “widening wedge” on the basis of “Three Indians”. A break of support at 0.7365 will increase the risks of a pullback.

UserPostedImage

More:
https://goo.gl/MCoSrp 
riki143
  • Posts: 1104
  • Joined: 15/08/2017
AUD/USD Daily Analytics
07:30 19.02.2018
Recommendations:

SELL 0.7895 SL 0.795 TP 0.7795

BUY 0.7985 SL 0.793 TP1 0.8055 TP2 0.8095 TP3 0.8185

On the daily chart of AUD/USD, bulls didn’t manage to overcome an important resistance level of 0.7985. As a result, the pair consolidated in the 0.7895-0.7985 area. When the pair gets out of this range, this will determine the further fate of the Aussie.

UserPostedImage

On H1, a break of support at 0.7895 will trigger the “Shark” pattern with a target at 88.6%. On the other hand, successful test of resistance at 0.7985 will increase the risks of a rally. Don’t exclude the possibility of a “Widening wedge”.

UserPostedImage

More:
https://fbs.com/analytics/articles/aud-usd-is-tired-of-a-cage-6876 
riki143
  • Posts: 1104
  • Joined: 15/08/2017
EUR/USD Daily analytics
13:52 19.02.2018

UserPostedImage

The main trend is still bullish, but the price faced resistance at 1.2537, so there's a "V-Top" pattern. Therefore, the market is likely going to test the nearest support at 1.2493 - 1.2453, which could be a departure point for another upward price movement.

UserPostedImage

There's a bearish "Flag" pattern, so the pair is likely going to test the closes support at 1.2355 - 1.2325. However, if a pullback from these levels arrives little later on, we could have a bullish price movement in the direction of the next resistance at 1.2434 - 1.2456.

More:
https://fbs.com/analytics/articles/eur-usd-bearish-flag-pattern-6881 
riki143
  • Posts: 1104
  • Joined: 15/08/2017
GBP/USD Daily Analytics
13:54 19.02.2018

UserPostedImage

Bulls faced with resistance at 1.4149, so we've got a "V-Top" pattern. Therefore, we should keep an eye on the nearest support at 1.3915 as an intraday target. If a pullback from this level happens afterwards, bulls will probably try to achieve another resistance at 1.4066 - 1.4149.

UserPostedImage

There's a consolidation, which is taking place near the 55 Moving Average. The main intraday target is the closest support at 1.3923. Meanwhile, if we have a pullback from this level, there'll be a moment for a bullish price movement towards the next resistance at 1.4066 - 1.4100.

More:
https://fbs.com/analytics/articles/gbp-usd-v-top-pattern-6882 
riki143
  • Posts: 1104
  • Joined: 15/08/2017
EUR/USD Daily Analytics
14:05 19.02.2018

UserPostedImage

There's a bullish "Harami", which has been confirmed. So, the price is likely going to test the 21 Moving Average, which could be a departure point for another downward price movement.

UserPostedImage

We've got a "Harami" and a "Hammer", which both have been formed on the 89 Moving Average. In this case, bulls are likely going to test the upper "Window". If this level acts as resistance, bears will probably try to test the next support area.

More:
https://goo.gl/H4bih5 
riki143
  • Posts: 1104
  • Joined: 15/08/2017
USD/JPY Daily Analytics
14:07 19.02.2018

UserPostedImage

There's a confirmed bullish "Harami", so the market is likely going to reach the 21 Moving Average. If a pullback from this line happens little later on, there'll be a moment for another decline.

UserPostedImage

We've got a bearish "Doji", which hasn't been confirmed yet. So, it's likely to have a local correction in the coming hours. Nevertheless, bulls will probably try to achieve the 89 Moving Average afterwards.

More:
https://goo.gl/fzZNkB 
riki143
  • Posts: 1104
  • Joined: 15/08/2017
USD/JPY Daily Analytics
06:37 20.02.2018
Technical levels: support – 106.00; resistance – 107.15.

Trade recommendations:

Sell — 107.15; SL — 107.35; TP1 — 106.30; TP2 — 106.00.
Reason: narrowing bearish Ichimoku Cloud with falling Senkou Span B; a dead cross of Tenkan-sen and Kijun-sen, but narrowing channel of the lines; the market is in correctional movement to the Cloud.

UserPostedImage

More:
https://goo.gl/8GGrh9 
riki143
  • Posts: 1104
  • Joined: 15/08/2017
AUD/USD Daily analytics
06:36 20.02.2018
Technical levels: support – 0.7880; resistance – 0.7980

Trade recommendations:

Sell — 0.7900; SL — 0.7920; TP1 — 0.7820; TP2 — 0.7770.
Buy — 0.7920; SL — 0.7900; TP1 — 0.7980; TP2 — 0.8020.
Reason: narrow bearish Ichimoku Cloud with falling Senkou Span A; a golden cross of Tenkan-sen and Kijun-sen, but the narrowing channel Tenkan-Kijun; the prices keeps staying inside a Cloud and the channel Tenkan-Kijun.

UserPostedImage

More:
https://goo.gl/ixaAj8 
riki143
  • Posts: 1104
  • Joined: 15/08/2017
XAU/USD Daily Analytics
06:55 20.02.2018
Recommendations:

BUY $1320 SL $1305 TP1 $1350 TP2 $1365 TP3 $1400

BUY $1300 SL $1285 TP1 $1330 TP2 $1350 TP3 $1365

On the daily chart, XAU/USD bulls didn’t manage to overcome significant resistance at $1360-1365 an ounce. As a result, the risks of correction and triggering of the “Bat” pattern increased. At the same time, the trend remains bullish, so pullbacks from diagonal support may be used for buying.

UserPostedImage

On H1 of XAU/USD, the “Shark” pattern is being triggered. Its 88.6% corresponds to the level of $1,323 an ounce. It is in the $1320-1323 convergence area.

UserPostedImage

More:
https://goo.gl/SuXbMg 
riki143
  • Posts: 1104
  • Joined: 15/08/2017
USD/CAD Daily analytics
07:01 20.02.2018
Recommendation:

BUY 1.2645 SL 1.259 TP1 1.2745 TP2 1.2850

SELL 1.2510 SL 1.2565 TP1 1.2410 TP2 1.2300

On the daily chart, USD/CAD is at the crossroads. A break of resistance at 1.2645 will give bulls hope for reaching 88.6% and 161.8% of the “Shark” and AB=CD. On the other hand, decline below support at 1.2460 will increase the risk of downtrend’s resumption.

UserPostedImage

On H1 of USD/CAD, a break above diagonal resistance near 1.2510 will allow bears to reach 88.6% target of the “Bat”.

UserPostedImage

More:
https://goo.gl/kkhciB 
riki143
  • Posts: 1104
  • Joined: 15/08/2017
EUR/USD Daily analytics
12:02 20.02.2018

UserPostedImage

The main trend is still bullish, but there's a "V-Top" pattern, so the price is declining. The main intraday target is the nearest support at 1.2332 - 1.2296. If a pullback from this area happens little later on, there'll be an opportunity to have another upward price movement towards the next resistance at 1.2384 - 1.2434.

UserPostedImage

Bears faced with support at 1.2355, so the pair is likely going to test the closest resistance at 1.2391 - 1.2415. If a pullback from these levels happens, the market will probably try to achieve another support at 1.2325 - 1.2296.

More:
https://goo.gl/ajk7Wq 
riki143
  • Posts: 1104
  • Joined: 15/08/2017
GBP/USD Daily analytics
12:04 20.02.2018

UserPostedImage

There's a "V-Top" pattern, so the pair is likely going to test the 89 Moving Average soon. If a pullback from this line arrives afterwards, there'll be an opportunity to have an upward price movement in the direction of the next resistance at 1.4011 - 1.4066.

UserPostedImage

All the Moving Averages have been broken, so the price is declining. The main intraday target is the closest support at 1.3875 - 1.3845, which could be a departure point for another bullish rally.

More:
https://goo.gl/Zkm2NA 
riki143
  • Posts: 1104
  • Joined: 15/08/2017
EUR/USD Daily Analytics
12:08 20.02.2018

UserPostedImage

The last bearish "Harami" led to the current upward price movement. There's no any reversal pattern so far, which means the pair is likely going to continue moving down in the short term.

UserPostedImage

All the Moving Averages have been broken, so the market is moving down towards the lower "Window". If any reversal pattern forms little later on, we could have an upward correction.

More:
https://goo.gl/ozSL1z 
riki143
  • Posts: 1104
  • Joined: 15/08/2017
USD/JPY Daily Analytics
12:09 20.02.2018

UserPostedImage

There's a bullish "Harami", which has been confirmed, so the price reached the 21 Moving Average. However, there's no any bearish pattern, so the pair is likely going to test the 89 MA.

UserPostedImage

The price has been rising since a "Harami" formed at the last local low. If the 55 Moving Average acts as support, there'll be an opportunity to have another bullish price movement.

More:
https://goo.gl/Vh5yUs 
riki143
  • Posts: 1104
  • Joined: 15/08/2017
TELEGRAM HAS BEATEN RECORDS
13:15 20.02.2018
If you do not know anything about Telegram’s pre-ICO or just forgot, we will give you some key points. Telegram is planning to launch its own blockchain the “Telegram Open Network” (TON). TON will have a lot of advantages such as decentralization, high security, capacity to hold fiat and Telegram’s currency in one wallet, and the main advantage will be the speed and volumes of transactions. At the same time Telegram is going to create its own cryptocurrency with a name “Gram”. The aim of the Telegram was to raise $850 million in a private sale of tokens and $1.15 billion in a public sale.

UserPostedImage

So talks about the blockchain TON and pre-ICO have been existing since the end of 2017. But there were not any comments from the Telegram cofounder Mr. Durov, when just several days ago he broke the silence. According to a document, he submitted to the US Securities and Exchange Commission (SEC), in January the company had raised $850 million from 81 investors. Their names are hidden, however, there is information of at least two persons. They are co-founders of two Russian companies: Qiwi and Wimm-Bill-Dann, who invested $17 and $10 million, respectively. An interesting fact is that Pavel Durov limited the possible number of investments.

Officially it was not the ICO. It can be called as a closed placement of securities in dollars and euros. Investors bought rights to the project's cryptocurrency, so before the launch of tokens, they received securities that implied participation in the future distribution of coins. According to the document, investments will be used only “for the development of the TON Blockchain, the development and maintenance of Telegram Messenger and other purposes” and not for Durov brothers benefit. Talking about future plans, the company is going to raise an additional $1.15 billion via public crowdsale. However, there is not a firm date, all we know that it is planned in March 2018.

But when will we see the results of such huge investments? An early minimum viable product (MVP) version of TON is planned to be released in the second quarter of 2018 with the Telegram wallet service in the fourth quarter. All TON services together with tokens “Gram” are scheduled for launch in 2019.

Making a conclusion, we can say that the Telegram pre-ICO has already beaten all records. The previous ICO record was set by Tezos that raised $232 million. There were only two more other coin projects that got more than $200 million, they are Filecoin and Bancor.

If you want more information about the TON and plans of Telegram, you can read our article

More:
https://goo.gl/dJxHqm 
riki143
  • Posts: 1104
  • Joined: 15/08/2017
THE USA VS THE EUROZONE
14:50 20.02.2018
There are a lot of factors that affect currencies markets. They are divided into two groups: unpredictable and predictable events. The first group of unpredictable events includes political news and natural disasters. The second group, that we will consider today, covers economic indicators that are displayed in an economic calendar and released at the exact time.

These indicators show the economic growth and health, they cause exact monetary policy decisions of central banks. If traders know how these figures influence the economy and currency, they will know how to trade.

We offer you to compare the last data on the main indicators of the two world’s largest economies: American and European. Under the table, you will find an explanation.

UserPostedImage

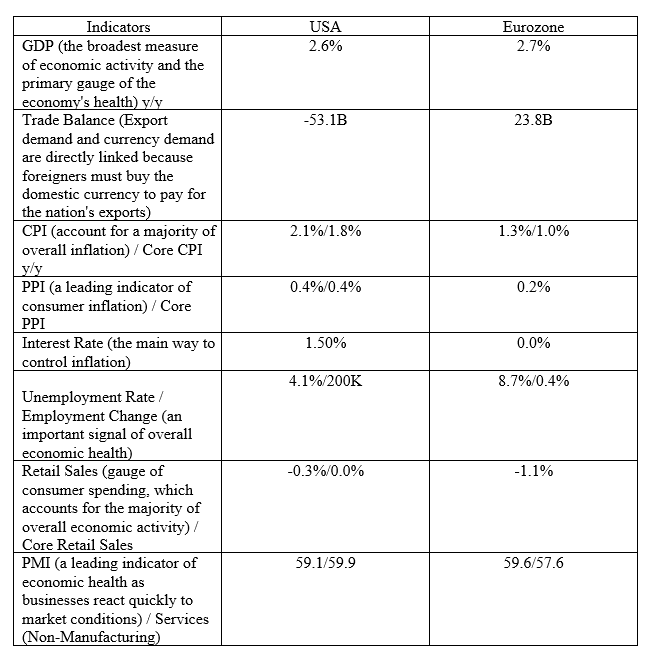
Let’s start with GDP (Gross Domestic Product). As we can see from the table, the American and Eurozone GDPs are almost similar. It shows the stable growth of economies as GDP is the broadest indicator of the economic health. An important fact is when the GDP rises, the domestic currency’s rate grows.
Trade Balance. When deficit happens to the trade balance, it leads to the fall of the domestic currency. Comparing figures of the American and European trade balance, we see a deficit in American balance and profit in European. If you look at currency rates, you will see that the US dollar is depreciating now, when the euro remains firm. Although there are many other factors that influence the currencies, trade balance plays its part.
CPI (Consumer price index) and PPI (Product price index) are two of the most important indicators of a monetary policy. CPI estimates an inflation level. And according to this level, a central bank decides which monetary policy to apply. The normal level of inflation is 2%, so all banks aim to reach this figure. If the inflation above 2%, the same when it is much below 2%, it is bad for the currency, the domestic currency depreciates. When we compare the data of the US and the EU, we can see that the CPI data is bigger in the US, it means that inflation is higher there, that is why the Fed has already started tightening its policy and increasing the interest rate. It will positively affect the greenback. The Eurozone CPI is not so high, that is why as we know the ECB is not going to raise the interest rate in the close future. Now it is just tapering quantitative easing.
Central bank uses interest rates to control inflation in a country. When inflation is near 2%, a central bank starts to tighten its policy, rising interest rates. It positively affects a domestic currency. When a central bank slows down interest rates, inflation rises, so it is bad for domestic currency. If we look at rates, we can see that the EU has the lowest rate of 0.0%. Such low rate is not good for the euro. Here we can say that the US rate of 1.5% affects the US dollar more positively than 0.0% rate the euro.
The lower Unemployment rate data leads to currency’s growth. We can notice that unemployment is in 2 times lower in the US, so it shows the positive growth of the US economy.
The Eurozone does not release Core Retail Sales (Retail Sales excluding Autos), that is why you cannot find the second figure in the table. So let’s compare Retail Sales. When retail sales increase, a domestic currency may appreciate. According to RS figures, the US economy has better data, so consumer spending is higher in the US, the economy is growing faster, it is good for the US dollar. However, both figures are negative, that is a bad sign for an economic growth.
The last but not least indicator is PMI. It is a survey of manufacturing and service industries that shows the economic health. Looking at the data, we can say that figures are almost similar in both economies. Moreover, figures above 50.0 mean industry expansion, so we can say about expansion in manufacturing and services in America and Europe.

UserPostedImage

Making a conclusion, we can say that the US economy looks better than the European one in more indicators. You can think that despite good indicators, the greenback has been falling for a long time when the euro is steady. But you should not forget about other factors that affect currency rates: positive indicators of other currencies, political issues, and traders’ mood. Tightening of the Fed’s monetary policy can lead to the rise of the US dollar soon. Positive economic indicators support this trend. At the same time, although now the European economy is failing against the American one, experts see a potential. Tapering of quantitative easing may lead to the growth of the inflation that will let increase the interest rate and will support the euro in the future. Good figures of GDP, trade balance and PMI will support the Eurozone’s economy.

More:
https://goo.gl/As9zmC 
riki143
  • Posts: 1104
  • Joined: 15/08/2017
USD/CHF Daily Analytics
06:34 21.02.2018
Recommendation:

BUY 0.9410

SL 0.9355

TP1 0.9510 TP2 0.9590

On the daily chart of USD/CHF, bulls are trying to counterattack and trigger the “Shark” pattern. Its 88.6% target is near 0.9775. As there’s a distinct downtrend, we doubt in the pair’s ability to rise to this level, though everything is possible.

UserPostedImage

On H1, if USD/CHF exits the downtrend channel and breaks above resistance at 0.9410 with the following activation of the “Shark” pattern, the odds of advance to 0.9590 will increase.

UserPostedImage

More:
https://goo.gl/XeC5FS 
riki143
  • Posts: 1104
  • Joined: 15/08/2017
GBP/USD Daily Analytics
06:40 21.02.2018
Recommendation:

SELL 1.4080 SL 1.4135 TP1 1.3980 TP2 1.3845 TP3 1.3690

SELL 1.3935 SL 1.3990 TP1 1.3845 TP2 1.3690 TP3 1.3555

On the daily chart of GBP/USD, the inability of bulls to settle above an important level of 1.4050 points at their weakness. A successful test of the lower border of the short-term uptrend channel will increase the risks of the pair going to 88.6% target of the “Bat”.

UserPostedImage

On H1, GBP/USD has reached the target of the “Wolfe waves” pattern. A break of support at 1.3935 or the recoil down from the upper border of the descending channel will open the way down for bears.

UserPostedImage

More:
https://goo.gl/g4f9fM 
riki143
  • Posts: 1104
  • Joined: 15/08/2017
EUR/USD Daily Analytics
06:56 21.02.2018
Technical levels: support – 1.2290; resistance – 1.2380.

Trade recommendations:

Buy — 1.2290; SL — 1.2270; TP1 — 1.2380; TP2 — 1.2450
Reason: narrowing bullish Ichimoku Cloud with falling Senkou Span A; a new dead cross of Tenkan-sen and Kijun-sen, but the lines are horizontal; the prices are entered into the negative area, but there is a strong support on 1.2290.

UserPostedImage

More:
https://goo.gl/W1vjAN 
riki143
  • Posts: 1104
  • Joined: 15/08/2017
GBP/USD Daily analytics
06:58 21.02.2018
Technical levels: support – 1.3980, 1.3880; resistance – 1.4020, 1.4100.

Trade recommendations:

Sell — 1.3970; SL — 1.3990; TP1 — 1.3880; TP2 — 1.3810.
Reason: expanding bearish Ichimoku Cloud with falling Senkou Span A; a new dead cross of Tenkan-sen and Kijun-sen and falling Tenkan-sen; the prices are on the Kijun’s support, but the Bears may breaking down it.

UserPostedImage

More:
https://goo.gl/c9zurz 
riki143
  • Posts: 1104
  • Joined: 15/08/2017
IS THE EURO’S FALL SO DRAMATIC?
13:14 21.02.2018
The euro started falling since the last Friday, February 16 and of course, it happened not without reasons. There are some factors that are negatively affecting the fiber now. So let’s look at them and conclude how they can affect the EUR/USD pair in the future.

First of all, the Euro is under the pressure because of a vote in Germany. Angela Merkel is waiting for the results of the potential coalition partner Social Democrats. Results of the vote will be announced only on March 4. If Angela Merkel is able to form a coalition, the euro will find a support, if not, so not.
Another important event for the European Union and the euro will happen on March 4 as well – the Italian Parliamentary election. Coalition parties cannot agree on the issue whether Italy will be in the European Union or not. If opposition forms the majority in the government, it will shake the stability of the EU and the euro. So in accordance with results of the election, the euro will appreciate or fall.
US dollar’s strengthening causes a further decrease of the euro. Today is the second day when the dollar index is rising after the crucial fall last week to the three-year lows. The increase of US Treasury yields helps the dollar to recover, too. So the more the US dollar strengthens its positions, the more the euro falls.
Today manufacturing PMI and services PMI data put more pressure on the fiber and proved its decline. Both figures appeared less than previous ones and even less than forecasts. The PMI is a leading indicator of the economic growth, so traders highly take it into consideration. So the euro has continued to fall.

UserPostedImage

However, the picture is not so dramatic. Despite the fact that Eurozone business growth lost some points in February, it still remains strong and anticipated to return its positions soon. According to the report, the European economy is expanding at the fastest pace in eight years. It means that the economic growth is on a quite good level, that will give reasons to the ECB to raise interest rates.

Another fact that can make the future of the euro more positive is the whole picture of the currency movement. If we look at the daily chart, we will see that the position of the euro is not so bad. The pair is almost repeating movements of the end of January – beginning of February. So the EUR/USD pair is moving in the trading channel with a resistance at 1.2520 and a support at 1.2210. Also, we can see the main upward trend since the middle of December 2017.

UserPostedImage

More:
https://goo.gl/w7UBMr 
riki143
  • Posts: 1104
  • Joined: 15/08/2017
EUR/USD Daily Analytics
14:03 21.02.2018

UserPostedImage

The main trend is still bullish, but the pair is likely going to test the nearest support at 1.2275 - 1.2246. If a pullback from this area happens, there'll be a moment to have another upward price movement towards the next resistance at 1.2332 - 1.2384.

UserPostedImage

The market went through the nearest support at 1.2325, so the price is declining. In this case, we should keep an eye on the next support at 1.2275, which could be a departure point for a bullish price movement.

More:
https://goo.gl/5fYq8X 
riki143
  • Posts: 1104
  • Joined: 15/08/2017
GBP/USD Daily analytics
14:06 21.02.2018

UserPostedImage

The price is consolidating along the Moving Averages. The main intraday target is the next support at 1.3835. If a pullback from this level happens, there'll be a moment for a bullish price movement towards another resistance at 1.4011 - 1.4066.

UserPostedImage

The pair has been declining since the last "V-Top" pattern formed. It's likely that the market is going to test the nearest support at 1.3875 - 1.3835 in the coming hours.

More:
https://goo.gl/d3Cskb 
riki143
  • Posts: 1104
  • Joined: 15/08/2017
EUR/USD: "MORNING DOJI STAR"
14:15 21.02.2018

UserPostedImage

There's a bullish "Harami" at the last low, so the market is likely going to test the Moving Averages. If a pullback from these lines happens little later on, we could have another decline.

UserPostedImage

We've got a "Morning Doji Star", so the pair is likely going to reach the 55 & 89 Moving Averages. If these lines act as resistance, we should keep an eye on the lower "Window" as the next bearish target.

More:
https://goo.gl/1ZcHbm 
riki143
  • Posts: 1104
  • Joined: 15/08/2017
USD/JPY Daily Analytics
14:17 21.02.2018

UserPostedImage

There's a bearish "Engulfing", which has been formed on the upper "Window". So, we're likely going to have a local bearish correction. Anyway, bulls will probably try to reach the next "Window" afterwards.

UserPostedImage

We've got bearish patterns such a "Tower" and a "Shooting Star". Therefore, the market is likely going to decline in the short term.

More:
https://goo.gl/L7j3sy 
riki143
  • Posts: 1104
  • Joined: 15/08/2017
EUR/JPY Daily Analytics
06:21 22.02.2018
Recommendation:

SELL 132.25

SL 132.80

TP1 131.25 TP2 130.45

On the daily chart, EUR/JPY is slowly but surely moving 113% target of the “Shark” pattern. It settled below an important support at 132.2 (23.6% of the long-term bullish wave) and formed a bar with a long upper shadow – a sign that bears are serious.

UserPostedImage

On H1 of EUR/JPY, sellers managed to reach targets of a triangle. If their rivals fail to return the pair inside this pattern, a pullback from resistance at 132.20-132.30 will be a signal for short positions.

UserPostedImage

More:
https://goo.gl/BsCsTU 
riki143
  • Posts: 1104
  • Joined: 15/08/2017
USD/JPY Daily Analytics
06:29 22.02.2018
Recommendation:

SELL 107.15

SL 107.70

TP1 106.60 TP2 105.35 TP2 103.20

On the daily chart, USD/JPY bulls managed to return the pair to the previous long-term consolidation range of 107.35-115.50. Father fate of the yen will depend on the results of the fight for 107.35. The necessary condition for the downtrend’s resumption is the pair’s decline below support at 106.60.

UserPostedImage

On H1, USD/JPY formed several inside bars. This points at the uncertainty. To continue the decline bears have to keep the pair out of uptrend channel.

UserPostedImage

More:
https://goo.gl/KD6Ewv 
riki143
  • Posts: 1104
  • Joined: 15/08/2017
AUD/USD Daily Analytics
07:08 22.02.2018
Technical levels: support – 0.7770; resistance – 0.7820

Trade recommendations:

Sell — 0.7820; SL — 0.7840; TP1 — 0.7770; TP2 — 0.7730.
Reason: expanding bearish Ichimoku Cloud with falling Senkou Span A; a dead cross of Tenkan-sen and Kijun-sen with the falling lines; the Bulls are breaking down the Cloud’s support and going to 2-week lows.

UserPostedImage

More:
https://goo.gl/uqh5Ex 
riki143
  • Posts: 1104
  • Joined: 15/08/2017
USD/JPY Daily Analytics
07:09 22.02.2018
Technical levels: support – 107.20; resistance – 108.00.

Trade recommendations:

Buy — 107.50/60; SL — 107.30; TP1 — 108.00; TP2 — 108.40.
Reason: narrowing bearish Ichimoku Cloud with rising Senkou Span A; a golden cross of Tenkan-sen and Kijun-sen with the rising lines; the prices entered inside a Cloud and fixed up above Tenkan-sen.

UserPostedImage

More:
https://goo.gl/BRULmU 
riki143
  • Posts: 1104
  • Joined: 15/08/2017
EUR/USD Daily analytics
11:42 22.02.2018

UserPostedImage

All the Moving Averages have been broken, so the price is declining. At the same time, there's an opportunity to have a local upward correction towards the nearest resistance at 1.2296 - 1.2332. If a pullback from this area happens little later on, bears will probably try to achieve the next support at 1.2205.

UserPostedImage

The price has been declining since the last "Pennant" pattern was broken. It's likely that the pair is going to test the Moving Averages, which could be a departure point for another decline.

More:
https://goo.gl/D25c5h 
riki143
  • Posts: 1104
  • Joined: 15/08/2017
GBP/USD Daily Analytics
11:44 22.02.2018

UserPostedImage

The last "V-Top" pattern led to the current decline. However, the pair is likely going to test the 55 Moving Average. If a pullback from this line happens afterwards, there'll be a moment for another decline.

UserPostedImage

There's a "V-Bottom" pattern, so the market is likely going to test the Moving Averages. Meanwhile, if we have a pullback from these lines, bears will probably try to reach the next support at 1.3835 - 1.3799.

More:
https://goo.gl/5XkZs7 
riki143
  • Posts: 1104
  • Joined: 15/08/2017
EUR/USD Daily analytics
11:47 22.02.2018

UserPostedImage

There's a bullish "Hammer", which hasn't been confirmed yet. Therefore, the price is likely going to test the 55 Moving Average, which could act as resistance. If so, there'll be an opportunity to have another decline.

UserPostedImage

We've got a bullish "Harami" at the last low, but confirmation of this pattern isn't enough. So, we could have just a local upward correction towards the Moving Averages in the short term.

More:
https://goo.gl/G7Z1KU 
riki143
  • Posts: 1104
  • Joined: 15/08/2017
USD/JPY Daily Analytics
11:55 22.02.2018

UserPostedImage

The upper "Window" acted as resistance, so there's an "Engulfing" pattern. In this case, we're likely going to have a bearish correction in the short term. Nevertheless, bulls will probably try to test the "Window" once again afterwards.

UserPostedImage

The price has reached the 55 Moving Average, but there's still no any reversal pattern. So, the pair is likely going to continue moving down in the coming hours in the direction of the next support area.

More:
https://goo.gl/rh1Tk2 
riki143
  • Posts: 1104
  • Joined: 15/08/2017
EUR/USD Daily Analytics
05:05 26.02.2018
Technical levels: support – 1.2300; resistance – 1.2380.

Trade recommendations:

Buy — 1.2300/10; SL — 1.2280; TP1 — 1.2380; TP2 — 1.2450
Sell — 1.2270; SL — 1.2300; TP1 — 1.2220; TP2 — 1.2180
Reason: expanding bearish Ichimoku Cloud with falling Senkou Span A; a dead cross of Tenkan-sen and Kijun-sen, Tenkan-sen is horizontal; the market is on the strong support of 1.2300.

UserPostedImage

More:
https://goo.gl/bRbBFC 
riki143
  • Posts: 1104
  • Joined: 15/08/2017
GBP/USD Daily analytics
05:07 26.02.2018
Technical levels: support – 1.3960; resistance – 1.4010, 1.4050.

Trade recommendations:

Buy — 1.4000; SL — 1.3980; TP1 — 1.4050; TP2 — 1.4100.
Sell — 1.3930; SL — 1.3950; TP1 — 1.3870; TP2 — 1.3810.
Reason: bearish Ichimoku Cloud with horizontal Senkou Span A and B; a dead cross of Tenkan-sen and Kijun-sen, but the narrowing channel of the lines; the prices are returned to the Cloud.

UserPostedImage

More:
https://goo.gl/BAKSkh 
riki143
  • Posts: 1104
  • Joined: 15/08/2017
NZD/USD Daily Analytics
08:11 26.02.2018
Recommendations:

SELL 0.728 SL 0.7335 TP1 0.7205 TP2 0.717

BUY 0.743 SL 0.7375 TP1 0.753 TP2 0.763

On the daily chart NZD/USD, bulls should break the resistance at 0.743 to continue the rally. On the contrary, if quotations are out the uptrend channel, it will strengthen risks of a pullback.

UserPostedImage

On H1, the pair reached targets of the “Broadening wedge” pattern. The break of the resistance at 0.7365 will activate the “Shark” pattern. This level is in the “dead zone”. A rebound from the bottom line of the uptrend channel will support a sale of Kiwi.

UserPostedImage

More:
https://goo.gl/YkVZR8 
riki143
  • Posts: 1104
  • Joined: 15/08/2017
AUD/USD Daily Analytics
08:15 26.02.2018
Recommendations:

BUY 0.79

SL 0.7845

TP1 0.799 TP2 0.8055

On the daily chart AUD/USD, the exit of quotations from the downtrend channel and the break of resistance at 0.7892-0.7902 will increase risks of the activation of Gartley pattern and the continuation of the pair’s rise in the direction of its 78.6% target. Vice versa, a rebound will let bears continue correction.

UserPostedImage

On H1 of AUD/USD, the pair reached targets of the "Widening wedge" and the "Shark" patterns. Currently, the “Crab” pattern is being activated. To continue the rally bulls should break the resistance at 0.79, 0.7945 and 0.799.

UserPostedImage

More:
https://goo.gl/tVBzFo 
riki143
  • Posts: 1104
  • Joined: 15/08/2017
EUR/USD Daily Analytics
12:08 26.02.2018

UserPostedImage

There's a bullish "Hammer", so the price is rising. Meanwhile, if a pullback from the nearest resistance area happens, there'll be a moment for another decline.

UserPostedImage

The 144 Moving Average is acting as resistance, but there's still no any reversal pattern. In this case, the market is likely going to test the closest support by the last "Three Methods" pattern, which could be a departure point for another upward price movement.

More:
https://goo.gl/ZmE7nq 
riki143
  • Posts: 1104
  • Joined: 15/08/2017
USD/JPY Daily Analytics
12:11 26.02.2018

UserPostedImage

The 21 & 34 Moving Averages have acted as resistance, but there's still no any reversal pattern. So, the pair is likely going to test the 21 MA once again. If a pullback from this line happens little later on, there'll be an opportunity to have another bearish price movement.

UserPostedImage

There's a bullish "Hammer", which has been confirmed enough, so the market is likely going to test the 21 Moving Average. If this line acts as resistance, bears will probably try to break the last low.

More:
https://goo.gl/UqajUL 
riki143
  • Posts: 1104
  • Joined: 15/08/2017
EUR/USD Daily Analytics
01:16 27.02.2018

UserPostedImage

The price is consolidating near the Moving Averages. Also, there's a possible "Triangle", so the pair is likely going to test the upper side of this pattern. If a pullback from this line happens little later on, there'll be an opportunity to have another decline.

UserPostedImage

There's a local "V-Bottom" pattern, so the pair is likely going to test the nearest resistance at 1.2355. If we have a pullback from this level, bears will probably try to achieve the closest support at 1.2254 - 1.2233.

More:
https://goo.gl/Z5zPoi 
Users browsing this topic
  • Guest
Forum Jump  
  • You cannot post new topics in this forum.
  • You cannot reply to topics in this forum.
  • You cannot delete your posts in this forum.
  • You cannot edit your posts in this forum.
  • You cannot create polls in this forum.
  • You cannot vote in polls in this forum.