LandOfCash Forex expert advisors, Trailing EA, Indicators.

Forex Trading Expert Advisors (EA or automated trading system) and Custom Indicators (CI) for MetaTrader Platform.

LOCTrailing With Partial Close Expert Advisor protect your orders profit. Trail stop level for manual and automatic orders with different algorithms, move stop loss into breakeven.

LOCInfo Custom Indicator follow the simple rules and make the right decision when to buy or sell. View Moving Average, Stochastic indicators from multiple time frames in one place.

riki143
  • Posts: 1104
  • Joined: 15/08/2017
GBP/USD Daily Analytics
01:19 27.02.2018

UserPostedImage

There's a "V-Top" pattern, so the market is declining. Meanwhile, it's likely to have a local upward correction in the coming hours. If a pullback from the nearest resistance at 1.4011 - 1.4066 happens afterwards, there'll be a moment for a decline.

UserPostedImage

Bears faced with support at 1.3930, so we've got a "V-Bottom". In this case, it's likely to have a bullish price movement in the direction of the nearest resistance at 1.4011 - 1.4048 in the coming hours.

More:
https://goo.gl/6T5umS 
riki143
  • Posts: 1104
  • Joined: 15/08/2017
AUD/USD Daily Analytics
06:04 27.02.2018
Technical levels: support – 0.7840; resistance – 0.7860, 0.7900

Trade recommendations:

Buy — 0.7850; SL — 0.7830; TP1 — 0.7900; TP2 — 0.7950.
Reason: bearish Ichimoku Cloud with horizontal Senkou Span A and B; a new golden cross of Tenkan-sen and Kijun-sen with the horizontal lines; the prices in consolidation above Tenkan-sen and Kijun-sen.

UserPostedImage

More:
https://goo.gl/kuvGJZ 
riki143
  • Posts: 1104
  • Joined: 15/08/2017
USD/JPY Daily Analyitcs
06:06 27.02.2018
Technical levels: support – 106.50; resistance – 107.00.

Trade recommendations:

Sell — 106.80; SL — 107.00; TP1 — 106.10; TP2 — 105.30.
Reason: bearish Ichimoku Cloud with horizontal Senkou Span A and B; a dead cross of Tenkan-sen and Kijun-sen, the lines are horizontal; the prices are inside of a Cloud, but the Dollar looks very weak.

UserPostedImage

More:
https://goo.gl/GqpGhc 
riki143
  • Posts: 1104
  • Joined: 15/08/2017
XAU/USD Daily Analytics
06:59 27.02.2018
Recommendations:

BUY $1344 SL $1329 TP $1374 TP2 $1390 TP3 $1410

SELL $1320 SL $1335 TP1 $1290 TP2 $1270

On the daily chart XAU/USD, a rebound from the bottom line of the uptrend channel allowed gold to hope for the bullish trend’s recovery again. Nevertheless, if a repeated test of the support at $1320 an ounce succeeds, risks of correction will increase.

UserPostedImage

On H1, there is a transformation of the “Shark” pattern in 5-0. A successful break of the support at $1329.5-1330.5 will activate a bearish trend. A necessary condition for the recovery of the bullish trend is the return of gold to the previous uptrend channel.

UserPostedImage

More:
https://goo.gl/uMpCHp 
riki143
  • Posts: 1104
  • Joined: 15/08/2017
USD/CAD Daily Analytics
07:04 27.02.2018
Recommendations:

BUY 1.2725 SL 1.267 TP1 1.285 TP2 1.2915

On the daily chart USD/CAD, there is a short-term consolidation in a range of 1.2615-1.2715. The break of its upper bound will let bulls count on the realization of 88,6% and 161,8% targets of “Shark” and AB=CD patterns. On the contrary, if quotations leave uptrend channel, risks of the long-term bearish trend’s recovery will increase.

UserPostedImage

On H1 of USD/CAD, a successful break of the resistance at 1.2725 will open a way to 88,6% and 200% targets of “Shark” and AB=CD patterns.

UserPostedImage

More:
https://goo.gl/CpEuZv 
riki143
  • Posts: 1104
  • Joined: 15/08/2017
EUR/USD Daily Analytics
12:26 27.02.2018

UserPostedImage

The Moving Averages are acting as resistance, so the last bearish "Engulfing" pattern is still on the table. In this case, if a pullback from the nearest resistance area happens little later on, there'll be a moment for another decline.

UserPostedImage

The 144 Moving Average has acted as resistance, so there're bearish patterns such a "Doji" and a "Harami". Therefore, we're likely going to have a decline during the day. Meanwhile, if any bullish pattern arrives afterwards, we could have an intraday upward price movement.

More:
https://goo.gl/Fnsuq4 
riki143
  • Posts: 1104
  • Joined: 15/08/2017
USD/JPY Daily Analytics
12:31 27.02.2018

UserPostedImage

There's a bullish "High Wave", so the price is rising. It's likely that the pair is going to test the 55 Moving Average soon. If a pullback from this line happens, we could have another decline.

UserPostedImage

The price is consolidating along the Moving Averages. Also, there's a bearish "Three Methods" pattern, so we're likely going to have a downward correction in the short term. However, if any bullish pattern forms little later on, there'll be a green light for an upward price movement towards the nearest resistance area.

More:
https://goo.gl/8GiFsh 
riki143
  • Posts: 1104
  • Joined: 15/08/2017
POWELL’S FIRST TESTIMONY: WILL THE DOLLAR FINALLY RISE?
14:51 27.02.2018
Last week the greenback could strengthen its position a little bit. However, since yesterday the US dollar was weakening against most major currencies because of the expectations of the today Jerome Powell’s first testimony to the Congress as Fed Chair. Traders were waiting if the new chairman will continue the monetary policy of his predecessor Janet Yellen or his policy will be more hawkish.

Let’s look at the main ideas of Powell’s testimony and will try to forecast its impact on the US dollar’s future.

As expected, Powell’s speech was hawkish. In his testimony Mr. Powell gave positive comments about the labour market, said that financial conditions are accommodative in spite of volatility, export is firm, fiscal policy is more stimulative. At the same time, he mentioned that inflation is still below 2% objective. As a conclusion, the chairman said that the Fed is aimed at the further gradual increases in the federal funds rate. It led to the rise of the US dollar.

However, the new chairman did not give clear clues on the amount of the future rate hikes. Furthermore, he did not mention the last important events that happened in the US economic world such as stock market selloff and an increase of the US Treasury yields. So the speech was superficial.

It creates doubts about the term of the dollar’s increase. First of all, Jerome Powell did not mention the number of rate hikes. Secondly, his testimony was not more hawkish than expected. Thirdly, the Fed is anticipated to raise the interest rate next month, so it is questionable that the traders will overvalue the increase. More likely they will look for further rate hikes. And the last but not least, the greenback is affected by a lot of factors: political and economic, so they will have a huge influence as well.

Making a conclusion we can say that the speech of Mr. Powell was expectedly optimistic. However, he did not risk, so did not give any additional comments about the rate hikes. “Further gradual increases” let the dollar recover after this week fall, however, it is still under pressure. More clues on the future monetary policy we can get during Powell’s testifies on Thursday, March 1 at 17:00 MT time.

More:
https://goo.gl/nZMH32 
riki143
  • Posts: 1104
  • Joined: 15/08/2017
EUR/USD Daily Analytics
01:29 28.02.2018

UserPostedImage

The last "Triangle" pattern has been broken, so the price is declining. The main intraday target is the next support at 1.2205 - 1.2164. If we have a pullback from these levels, there'll be an opportunity for an upward price movement towards the nearest resistance at 1.2246.

UserPostedImage

The price is consolidating under the broken "Triangle" pattern. It's likely to have a bullish correction in the coming hours. Meanwhile, if a pullback from the closest resistance at 1.2259 - 1.2275 happens little later on, we could have another decline.

More:
https://goo.gl/pqbFsA 
riki143
  • Posts: 1104
  • Joined: 15/08/2017
GBP/USD Daily Analytics
01:30 28.02.2018

UserPostedImage

There's a "Thorn" pattern, so the market is likely going to test the nearest resistance at 1.3979 - 1.4011. This area could be a departure point for a downward price movement in the direction of the next support at 1.3835.

UserPostedImage

We've got a local "V-Top", so there's a moment to have a local bearish correction. Anyway, bulls are likely going to achieve another resistance at 1.3958 - 1.3979 afterwards.

More:
https://goo.gl/VphHjX 
riki143
  • Posts: 1104
  • Joined: 15/08/2017
EUR/USD Daily Analytics
06:32 28.02.2018
Technical levels: support – 1.2220; resistance – 1.2250.

Trade recommendations:

Sell — 1.2250; SL — 1.2270; TP1 — 1.2180; TP2 — 1.2110
Reason: expanding bearish Ichimoku Cloud with falling Senkou Span A; a cancelled golden cross of Tenkan-sen and Kijun-sen and the lines are falling down; the market is on the 4W-lows and may go lower.

UserPostedImage

More:
https://goo.gl/wjuvpW 
riki143
  • Posts: 1104
  • Joined: 15/08/2017
GBP/USD Daily Analytics
06:34 28.02.2018
Technical levels: support – 1.3880; resistance – 1.3930.

Trade recommendations:

Sell — 1.3920; SL — 1.3940; TP1 — 1.3870; TP2 — 1.3810.
Reason: bearish Ichimoku Cloud with horizontal Senkou Span A and B; a cancelled golden cross of Tenkan-sen and Kijun-sen, the lines are horizontal; the prices going to the lows of the previous week.

UserPostedImage

More:
https://goo.gl/vqwmqr 
riki143
  • Posts: 1104
  • Joined: 15/08/2017
USD/CHF Daily Analytics
06:38 28.02.2018
Recommendation:

BUY 0.9415

SL 0.936

TP1 0.9515 TP2 0.96 TP3 0.977

On the daily chart of USD/CHF, bulls are gradually moving towards triggering the “Shark” pattern and its 88.6% target. The conditions necessary to continue the rally include the pair’s settling above support at 0.9380 and advance above resistance at 0.9450.

UserPostedImage

On H1 of USD/CHF, another test of resistance at 0.9410-0.9415 will increase the odds of a “Shark” pattern with a target at 88.6%. At the same time, the AB=CD pattern with targets at 200% and 224% will become viable.

UserPostedImage

More:
https://goo.gl/9Dj81w 
riki143
  • Posts: 1104
  • Joined: 15/08/2017
GBP/USD Daily Analytics
06:43 28.02.2018

Recommendation:

SELL 1.3850

SL 1.3905

TP1 1.375 TP2 1.3645 TP3 1.358

On the daily chart, GBP/USD is consolidating in the 1.3820-1.4050 range within the “Spike and ledge” pattern on the basis of 1-2-3. A break of its lower border will allow bears to continue correction towards 88.6% of the “Bat”. On the other hand, advance above resistance at 1.4050 will lead to the uptrend’s resumption.

UserPostedImage

On H1, GBP/USD after forming “Wofle waves” and a pullback from the upper border of the downtrend channel bears are ready to continue the decline.a

UserPostedImage

More:
https://goo.gl/p3cyVZ 
riki143
  • Posts: 1104
  • Joined: 15/08/2017
EUR/USD Daily Analytics
13:05 28.02.2018

UserPostedImage

The Moving Averages have acted as resistance, so the price is declining. However, we've got a bullish "High Wave" pattern, so there's an opportunity to have a local bearish correction in the short term. Nevertheless, the market is likely going to continue moving down afterwards.

UserPostedImage

There're bullish patterns such a "Harami" and a "Hammer", but both of them haven't been confirmed yet. So, the price is likely going to test the 55 Moving Average, which could be a departure point for another decline.

More:
https://goo.gl/DnFm1n 
riki143
  • Posts: 1104
  • Joined: 15/08/2017
USD/JPY Daily Analytics
13:07 28.02.2018

UserPostedImage

The 34 Moving Average has acted as resistance, so there's an "Evening Star", which has been confirmed. Therefore, the pair is likely going to test the nearest support area in the coming hours.

UserPostedImage

There's a pullback from the lower "Window", so we've got an "Inverted Hammer" pattern. In this case, we're likely going to have a local upward correction soon. Meanwhile, bears will probably try to deliver a new local low afterwards.

More:
https://goo.gl/m3SAR3 
riki143
  • Posts: 1104
  • Joined: 15/08/2017
EUR/USD Daily Analytics
00:06 01.03.2018

UserPostedImage

The main trend is still bullish, but there's a developing bearish correction, so we should keep an eye on the next support at 1.2129 - 1.2050 as an intraday target. If a pullback from this area happens little later on, we could have an upward price movement towards the nearest resistance at 1.2205 - 1.2246.

UserPostedImage

The price is consolidating between the levels 1.2233 - 1.2205. The main intraday target is the closest resistance at 1.2233, which could be a departure point for a decline in the direction of the next support at 1.2164.

More:
https://goo.gl/BXHDBT 
riki143
  • Posts: 1104
  • Joined: 15/08/2017
GBP/USD Daily Analytics
00:07 01.03.2018

UserPostedImage

All the Moving Averages have been broken, so the price is declining. It's likely that bears are going to test the nearest support at 1.3656. If a pullback from this level happens little later on, we could have an upward price movement towards the closest resistance at 1.3799 - 1.3835.

UserPostedImage

The last "Triangle" pattern led to the current decline. Meanwhile, it's likely to have a bullish correction in the short term. However, if we see a pullback from the nearest resistance at 1.3763 - 1.3799, there'll be a moment for another decline.

More:
https://goo.gl/w47KZ9 
riki143
  • Posts: 1104
  • Joined: 15/08/2017
AUD/USD Daily Analytics
06:04 01.03.2018
Technical levels: support – 0.7690; resistance – 0.7790

Trade recommendations:

Buy — 0.7690; SL — 0.7670; TP1 — 0.7760; TP2 — 0.7790.
Reason: bearish Ichimoku Cloud with falling Senkou Span A and B; a new dead cross of Tenkan-sen and Kijun-sen with the falling lines; the market made a new lows of the year, but there is a strong support on 0.7690.

UserPostedImage

More:
https://goo.gl/hPPzB1 
riki143
  • Posts: 1104
  • Joined: 15/08/2017
USD/JPY Daily Analytics
06:06 01.03.2018
Technical levels: support – 106.50; resistance – 107.00.

Trade recommendations:

Sell — 106.80; SL — 107.00; TP1 — 106.10; TP2 — 105.30.
Reason: bearish Ichimoku Cloud with falling Senkou Span A; a golden cross of Tenkan-sen and Kijun-sen, but the lines are horizontal and narrowing channel Tenkan-Kijun; the bears are breakdown the support of Senkou Span A, Tenkan-sen and Kijun-sen and the market may continue existing downtrend.

UserPostedImage

More:
https://goo.gl/FhKhuo 
riki143
  • Posts: 1104
  • Joined: 15/08/2017
EUR/JPY Daily Analytics
07:49 01.03.2018
Recommendations:

BUY 131.65

SL 131.1

TP1 132.65 TP2 133.7 TP3 134.3

On the daily chart EUR/JPY, the pair reached the 113% target of the “Shark” pattern. As a result, risks of the correction increased. The return of the pair to the previous low is a necessary condition for its implementation. If bulls fail, it will mean their weakness.

UserPostedImage

On H1, EUR/JPY reached targets of the triangle. Currently, “Wolfe Waves” pattern is developing. To implement it, the pair should come back to the resistance at 131.65 with its subsequent successful test.

UserPostedImage

More:
https://goo.gl/68kRgj 
riki143
  • Posts: 1104
  • Joined: 15/08/2017
USD/JPY Daily Analytics
07:53 01.03.2018
Recommendations:

BUY 107.85 SL 107.3 TP1 108.9 TP2 109.4 TP2 109.9

SELL 105.95 SL 106.5 TP1 104.95 TP2 103.95 TP3 102.8

On the daily chart USD/JPY, there is a short-term consolidation within the downtrend. A break of its lower bound near 106.6 will give hope to bears for the implementation of 127.2% and 161.8% targets of the AB=CD pattern.

UserPostedImage

On H1 of USD/JPY, bulls are trying to return quotations to the triangle and take the pair beyond the downtrend channel. If bulls succeed, the “Bat” pattern with the 88.6% target may be implemented.

UserPostedImage

More:
https://goo.gl/CJWMFS 
riki143
  • Posts: 1104
  • Joined: 15/08/2017
EUR/USD Daily Analytics
13:31 01.03.2018

UserPostedImage

There's an "Inverted Hammer", which hasn't been confirmed yet. So, the price is likely going to test the 21 Moving Average, which could be a departure point for another decline.

UserPostedImage

We've got a "Shooting Star", which has formed at the last local high. In this case, the pair is likely going to reach the nearest support area. If any bullish pattern forms little later on, there'll be a moment for an upward correction.

More:
https://goo.gl/Xt1Biq 
riki143
  • Posts: 1104
  • Joined: 15/08/2017
USD/JPY Daily Analytics
13:33 01.03.2018

UserPostedImage

The last "Evening Star" is still on the table, so the price is likely going to continue declining. Meanwhile, if a pullback from the nearest support area happens, we could have a bullish correction.

UserPostedImage

There's a bullish "High Wave", which has been confirmed enough. So, the pair is likely going to reach the nearest resistance area, which could be a departure point for another decline.

More:
https://goo.gl/LdJ4sU 
riki143
  • Posts: 1104
  • Joined: 15/08/2017
EUR/USD Daily Analytics
06:25 02.03.2018
Technical levels: support – 1.2200; resistance – 1.2300.

Trade recommendations:

Sell — 1.2280; SL — 1.2300; TP1 — 1.2200; TP2 — 1.2150
Reason: bearish Ichimoku Cloud, but rising Senkou Span A; a dead cross of Tenkan-sen and Kijun-sen with rising Tenkan-sen; the market made a new lows and bounced to Kijun-sen.

UserPostedImage

More:
https://goo.gl/aLPqJe 
riki143
  • Posts: 1104
  • Joined: 15/08/2017
GBP/USD Daily Analytics
06:27 02.03.2018
Technical levels: support – 1.3660; resistance – 1.3780, 1.3830.

Trade recommendations:

Sell — 1.3780; SL — 1.3800; TP1 — 1.3660; TP2 — 1.3610.
Reason: expanding bearish Ichimoku Cloud with falling Senkou Span A and B; a dead cross of Tenkan-sen and Kijun-sen with the falling lines; the market made a new lows and in correctional movement to Tenkan-sen now.

UserPostedImage

More:
https://goo.gl/UXNsHx 
riki143
  • Posts: 1104
  • Joined: 15/08/2017
EUR/USD Daily Analytics
07:00 02.03.2018
Recommendation:

SELL 1.2310 SL 1.2365 TP1 1.2210 TP2 1.2155 TP3 1.2080

SELL 1.2355 SL 1.2410 TP1 1.2255 TP2 1.2155 TP3 1.2080

On the daily chart, the return of EUR/USD inside the uptrend channel will increase the risks of the pair going to 161.8% and 224% of AB=CD patterns. On the other hand, if the euro falls to February lows, it will then go to 88.6% target of the “Shark”.

UserPostedImage

On H1 of EUR/USD, there is a “Widening wedge” pattern. Pullbacks from resistance at 38.2% and 50% of the wave 4-5 may be used for opening long positions. A break of 1.2470 and 1.2510, on the other hand, will open the way to the north.

UserPostedImage

More:
https://goo.gl/5ggTAh 
riki143
  • Posts: 1104
  • Joined: 15/08/2017
EUR/GBP Daily Analytics
07:08 02.03.2018
Recommendation:

BUY 0.8925

SL 0.887

TP 0.9015

On the daily chart, EUR/GBP remains within the 0.8695-0.9015 consolidation range. Its exit outside of it will be a signal of the uptrend’s resumption and increase the odds of formation of the senior AB=CD. The short-term successful test of resistance at 0.8925 will trigger AB=CD pattern and allow the bulls to reach 161.8% target.

UserPostedImage

On H1, if EUR/GBP rises to February highs, it will trigger AB=CD and “Crab” patterns. Its 161.8% targets form an important convergence area near 0.9015.

UserPostedImage

More:
https://goo.gl/TivkwX 
riki143
  • Posts: 1104
  • Joined: 15/08/2017
EUR/USD Daily Analytics
13:44 02.03.2018

UserPostedImage

There's an "Inverted Hammer", which has been confirmed. Also, we've got no any reversal pattern, so the price is likely going to test the nearest resistance area, which could be a departure point for another decline.

UserPostedImage

We've got a bullish "Doji", so all the Moving Averages have been broken. There's no any bearish pattern, so the pair is likely going to test the next resistance area in the coming hours.

More:
https://goo.gl/pTZtMY 
riki143
  • Posts: 1104
  • Joined: 15/08/2017
USD/JPY Daily Analyticss
13:46 02.03.2018

UserPostedImage

The last "Shooting Star" led to the current decline. The main intraday target is the lower "Window". If a pullback from this level happens little later on, there'll be a moment for an upward correction.

UserPostedImage

The price has been declining since a bearish "Harami" formed on the Moving Averages. There's no any reversal pattern so far, which means the market is likely going to continue moving down in the short term.

More:
https://goo.gl/djA378 
riki143
  • Posts: 1104
  • Joined: 15/08/2017
BTC/USD Daily Analytics
02:42 05.03.2018


The Bitcoin has been inserted in an upward phase since the lows of February 25, thanks to the fact that cryptocurrency has found demand above the key barrier of 8500. This has helped the price action to point upwards and the resistance of 11339 could be the next obstacle to face in the short term.

It should be remembered that the Fibonacci target of -23.6% in 12985 is the area where take profit orders could be activated, which in theory liquidates the long sustained positions from the demand zone of 38.2% in 9407. For the moment, the Parabolic SAR is helping to pressure the BTC/USD pair in the short term.

What do we expect?

According to our forecasts in the H1 chart, the pair aims to continue with the bullish movement, although the resistance of 11339 could be the line in the sand to overcome during this week. Should this be achieved, the path would be cleared for the Bitcoin to visit the Fibonacci target of -23.6% at 12985. The RSI remains in negative territory and the MACD indicator is showing that the bears could have an opportunity to correct the current price.

UserPostedImage

More:
https://goo.gl/rM6BMB 
riki143
  • Posts: 1104
  • Joined: 15/08/2017
USD/CHF Daily Analytics
02:43 05.03.2018

The USD/CHF pair has been trading in a corrective phase since March 1st session and it seems the 50% Fibonacci zone could be a key pivot point during the week ahead. The 0.9338 level should then become a support in order to give a boost to the pair in order to go towards the -23.6% Fibonacci zone at 0.9561. To the downside, if the pair manages to break below 0.9292, then it can plummet towards the 0.9186 level.

RSI indicator remains in the negative territory.

UserPostedImage

More:
https://goo.gl/v8277o 
riki143
  • Posts: 1104
  • Joined: 15/08/2017
EUR/USD Daily Analytics
07:44 05.03.2018
Technical levels: support – 1.2260; resistance – 1.2310, 1.2380.

Trade recommendations:

Buy — 1.2260; SL — 1.2240; TP1 — 1.2310; TP2 — 1.2380
Reason: narrowing bearish Ichimoku Cloud with rising Senkou Span A; a cancelled dead cross of Tenkan-sen and Kijun-sen with horizontal lines; the market testing the Cloud’s resistance.

UserPostedImage

More:
https://goo.gl/hvAFaH 
riki143
  • Posts: 1104
  • Joined: 15/08/2017
GBP/USD Daily Analytics
07:46 05.03.2018
Technical levels: support – 1.3760; resistance – 1.3830.

Trade recommendations:

Buy — 1.3760; SL — 1.3740; TP1 — 1.3830; TP2 — 1.3880.
Reason: bearish Ichimoku Cloud with horizontal Senkou Span A and B; a dead cross of Tenkan-sen and Kijun-sen with horizontal lines; the market had entered into the channel Tenkan-Kijun and may correcting to the Kijun’s levels.

UserPostedImage

More:
https://goo.gl/7diS34 
riki143
  • Posts: 1104
  • Joined: 15/08/2017
NZD/USD Daily Analytics
08:37 05.03.2018
Recommendation:

BUY 0.7280 SL 0.7225 TP1 0.7325 TP2 0.7395 TP3 0.7430

SELL 0.7185 SL 0.7240 TP1 0.7130 TP2 0.7085

On the daily, NZD/USD is consolidating in a range between 0.7185 and 0.7430. A break of its lower border will increase the risks of a correction. On the other hand, the return of the pair inside the uptrend channel with the following test of resistance at 0.7430 will open way up for the pair.

UserPostedImage

On H1, NZD/USD advance above the upper border of the downtrend channel and resistance at 0.7280 triggered the “Bat” and the “Crab” patterns with targets at 88.6% and 161.8%.

UserPostedImage

More:
https://goo.gl/LRSU2P 
riki143
  • Posts: 1104
  • Joined: 15/08/2017
AUD/USD Daily Analytics
09:40 05.03.2018
Recommendations:

BUY 0.7815

SL 0.776

TP 0.7905 TP2 0.7985 TP3 0.8075

On the daily chart AUD/USD, the “Wolfe waves” pattern is developing. If bulls manage to return the Aussie to the resistance at $0.7815, break it and take the pair beyond the downtrend channel, risks of the uptrend’s recovery will increase.

UserPostedImage

On H1 of AUD/USD, the break of the resistance at 23.6% from the last downtrend wave with the subsequent successful hit of the upper bound of the bearish channel will implement “Bat” and “Crab” patterns with 88.6% and 161.8% targets.

UserPostedImage

More:
https://goo.gl/stsxtz 
riki143
  • Posts: 1104
  • Joined: 15/08/2017
EUR/USD Daily Analytics
12:21 05.03.2018

UserPostedImage

The last "Inverted Hammet" and "High Wave" patterns led to the current upward price movement. Also, there's a bearish "High Wave", which hasn't been confirmed yet. Therefore, the price is likely going to test the closest resistance, which could be a departure point for a downward correction.

UserPostedImage

There's a confirmed bullish "Hammer", so the market is likely going to test the next resistance area in the coming hours. Meanwhile, if any reversal pattern forms little later on, there'll be a moment for a bearish correction.

More:
https://goo.gl/gPuE4C 
riki143
  • Posts: 1104
  • Joined: 15/08/2017
USD/JPY Daily Analytics
12:25 05.03.2018

UserPostedImage

The price has been declining since a "Shooting Star" pattern was formed on the Moving Averages. However, there's a bullish "Harami", so we could have a local upward correction in the short term. Anyway, bears will probably try to test the lower "Window" afterwards.

UserPostedImage

The price is consolidating under the Moving Averages. Also, we've got an "Engulfing" pattern, so the market is likely going to test the closest resistance area, which could be a departure point for another decline.

More:
https://goo.gl/mQMf64 
riki143
  • Posts: 1104
  • Joined: 15/08/2017
TRADE WARS ARE GOOD AND EASY TO WIN: IS IT REALLY SO?
14:09 05.03.2018
In the world of free trade, trade wars became a rare event. However, now we are coming back to them because of Mr. Trump’s policy.

Let’s start with the definition of a trade war.

Trade war is a negative result of protectionism. It occurs when one country (1) implements trade barriers such as tariffs or quotas against imported goods of another country (2). As the result, that country (2) has to retaliate with the same measures.

Trade wars happen when one country considers another country’s trade policy as unfair or aims to protect the domestic economy and make imported goods less attractive.

So why are we talking about trade wars and how can they affect markets?
Talks appeared after the US president Donald Trump announced that he is going to enact tariffs on steel and aluminum imports next week. It is anticipated to be a 25% tariff on steel and a 10% tariff on aluminum. The USA is the world’s biggest steel importer. So such measures will lead to the redistribution of forces on the steel market.

Mr. Trump said that trade wars are good and easy to win. However, let’s look if it reflects the reality.

It is worth to come back to the history. In 1930 the US president Herbert Hoover signed the Smooth-Hawley Tariff Act that increased tariffs on all manner of imports. In opposition to this, other countries implied tariffs against US goods. It led to such economic disasters as an enormous unemployment, exports, and imports plunge, banks and companies went out of business. So this Act made the Great Depression even worse.

That is why there are doubts that these tariffs will bring something good for the American economy. An imposing of tariffs will be dangerous for the job sector and living standards. Prices will rise, that will hurt the US consumers and put American companies at a serious disadvantage. The unemployment rate will increase. There is a possibility that tariffs will push steel and aluminum manufactures, but there are doubts that these sectors will be able to support an increased demand. Moreover, because of the rising steel and aluminum prices, the cost of raw materials will increase. So other sectors will suffer as well.

What is happening in markets
News about the tariffs has already affected stocks. The stock market fell immediately after Trump announced the soon tariffs’ implementation.

If tariffs will affect the US economy as we described above, it will lead to the depreciation of the greenback. The US dollar will not be able to stabilize its positions.

Furthermore, the imposing of the tariffs will affect not only the American economy but the world in general. A circle of retaliation will damage the global supply chains. Most of the products produced in one country are consists of inputs from other countries.

Even at the moment, the European Commission President Jean-Paul Juncker claimed that they will put tariffs on such American products as Harley-Davidson, bourbon and blue jeans - Levi’s. China is going to implement tariffs on American soybeans and sorghum. And later there will be more retaliation.

UserPostedImage

Making a conclusion, we can say that the claim of Mr. Trump that “trade wars are good and easy to win” is quite doubtful. According to the history, trade wars led to the economic depressions, unemployment, lack of supply, the suffering of different sectors. As we know, the Fed policy could support the US dollar last week and it is supposed to lead to its appreciation. However, Trump’s protectionism can lead to the fall of the US economy that will affect the greenback. Moreover, destabilization of the US economy will damage stability of the world supply chain and create problems for the manufacturing and labor market in world scales.

More:
https://goo.gl/2Ei2xa 
riki143
  • Posts: 1104
  • Joined: 15/08/2017
AUD/USD Daily Analytics
05:37 06.03.2018
Technical levels: support – 0.7690; resistance – 0.7790

Trade recommendations:

Sell — 0.7760; SL — 0.7790; TP1 — 0.7690; TP2 — 0.7600.
Reason: bearish Ichimoku Cloud, but rising Senkou Span A; a dead cross of Tenkan-sen and Kijun-sen with rising Tenkan-sen; the market is in correctional movement to the Cloud and the prices are breaking out the Kijun’s resistance.

UserPostedImage

More:
https://goo.gl/GuoQsF 
riki143
  • Posts: 1104
  • Joined: 15/08/2017
USD/JPY Daily Analytics
05:39 06.03.2018
Technical levels: support – 105.50; resistance – 106.50.

Trade recommendations:

Sell — 106.20; SL — 106.50; TP1 — 105.50; TP2 — 105.10.
Reason: bearish Ichimoku Cloud with falling Senkou Span A and B; a dead cross of Tenkan-sen and Kijun-sen, but rising Tenkan; the market had corrected to Kijun’s resistance and now may continue the downtrend.

UserPostedImage

More:
https://goo.gl/Lkc5en 
riki143
  • Posts: 1104
  • Joined: 15/08/2017
XAU/USD Daily Analytics
07:29 06.03.2018
Recommendations:

BUY $1328 SL $1313 TP2 $1346 TP2 $1358

SELL $1302 SL $1317 TP1 $1272 TP2 $1245

On the daily chart of XAU/USD, bulls to continue the rally to 127.2% and 1.618% of the senior and junior AB=CD need to overcome resistance at $1,340 and $1,360 an ounce. On the other hand, another test of support at $1,302 in case of success will lead gold to 88.6% target of the “Shark” pattern.

UserPostedImage

On H1, a break of resistance at $1,328 will open the way to 113% and 88.6% targets of the “Shark”.

UserPostedImage

More:
https://goo.gl/mQM4zP 
riki143
  • Posts: 1104
  • Joined: 15/08/2017
USD/CAD Daily Analytics
07:39 06.03.2018
Recommendation:

BUY 1.2915

SL 1.286

TP1 1.3015 TP2 1.3110

On the daily chart of USD/CAD, bulls managed to rise to an important level of 1.2920 and settle above it. Now they count on an advance to 127.2% target of AB=CD. At the same time, if the pair reached 113% of the “Shark”, the risks of a pullback will increase.

UserPostedImage

On H1, there is a “Spike and reversal with acceleration” pattern. The pair reached 224% target of AB=CD. This increases the odds of correction. The trend is bullish, so it will be wise to use pullbacks for opening long positions.

UserPostedImage

More:
https://goo.gl/PBirjB 
riki143
  • Posts: 1104
  • Joined: 15/08/2017
WILL THE EURO CHANGE ITS DIRECTION AFTER THE ITALIAN ELECTIONS?
10:34 06.03.2018
Italian parliamentary elections and German coalition votes started to affect the euro much earlier they were held. And when the German votes’ results could support the single currency, the Italian elections does not portend anything good for it.

The results of Italian votes were announced on Monday and created the environment of uncertainty not only for the euro but for Italy itself. No party or coalition won the majority in the government, so a hung parliament was formed. Moreover, the majority of all votes received the right-wing bloc of parties. The leader in the bloc is the anti-immigrant and euro-skeptic party “League”. A leader of the party Matteo Salvini is ready to leave the European Union and the Eurozone unless Brussels changes the current treatment Italy receives. He wants fewer constraints from the European Union. The anti-establishment Five Star Movement received the largest number of votes as the single party.

UserPostedImage

Where will Matteo Salvini lead Italy?

Why have these parties got such a huge support?

The answer is clear. Italian citizens are tired of enormous migration and economic problems.

The most crucial woe is poor career prospects. Unemployment is the biggest fear of Italians. Both parties promised to solve this issue, that led to their victory, especially, in the areas where the unemployment rate is incredibly high. Although Italy has the third-biggest economy in the Eurozone, its government debt is quite big. Net national debt is over 120% of GDP. So the Five Star Movement campaigned for a basic income. In addition, right-wing coalition promoted an anti-immigration policy, putting “Italians first”.

How will the results of elections affect the euro?

As we mentioned above, the active parliament has not been formed yet. It creates uncertainty both for Italy and the EU.

The hung parliament means the continuation of the parliament’s formation until one of the coalitions will get the majority. If parties do not back a coalition, Italy will not avoid another election. The period of the formation is unknown as well. So the euro will be under the pressure for the uncertain period that will be depicted by volatility.

More likely, that the euro-skeptic and anti-establishment parties will become the leading force in the government. It will create problems for the European Union, as the Italian economy is the third-biggest economy of the Eurozone after Germany and France. The EU managed to stabilize the economic growth, and now it is aiming to raise interest rates in soon future. It supposed to support the euro. However, if there are misunderstandings with the Italian government, the EU will have difficulties in the future.

Let’s look at the chart.

UserPostedImage

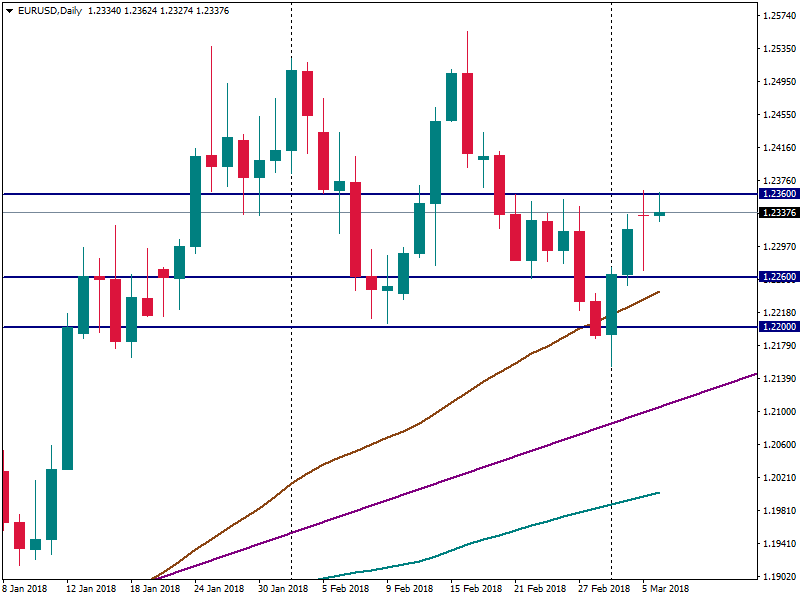
On Monday the EUR/USD pair showed big volatility. After the results of the German elections were announced, the single currency climbed to the important level of 1.2360. But the pair could not break the resistance because of the uncertain news from Italy. So the single currency fell to 1.2268. However, the pair closed almost at the level of the opening price.

Today, EUR/USD is climbing to the resistance at 1.2360 and if it manages to break it, there will be a good chance for the euro to move further.

It means that although the Italian elections create uncertainty, currently the euro has chances to recover. If the euro-skeptic parties will get the majority in the government, it will take a long time to solve all issues between the European Union and Italy. However, the euro will stay under the pressure, until all misunderstandings will be solved.

But in the short-term, the euro can be supported by such events as European central bank’s meetings and US data.

To sum up we can say that the Italian parliamentary elections create uncertainty for the euro area in the medium term. Although the euro was not affected too much and still has chances for recovery after the last week falls, it is under the pressure until the government will be finally formed and the issues between Italy and the EU will be solved. Any news on this topic will create volatility of the euro. We recommend you to closely follow the news.

More:
https://goo.gl/ecgMRZ 
riki143
  • Posts: 1104
  • Joined: 15/08/2017
EUR/USD Daily Analytics
12:13 06.03.2018

UserPostedImage

The main trend is still bullish, so it's likely that the price is going to reach the next resistance area at 1.2391 - 1.2434. If a pullback from these levels happens, there'll be a moment for a decline towards the nearest support at 1.2319 - 1.2296.

UserPostedImage

The price is consolidating above the Moving Averages. The main intraday target is the closest support at 1.2319 - 1.2296, which could be a departure point for an upward price movement in the direction of the next resistance at 1.2391 - 1.2434.

More:
https://goo.gl/Wb6osk 
riki143
  • Posts: 1104
  • Joined: 15/08/2017
GBP/USD Daily Analytics
12:19 06.03.2018

UserPostedImage

The 34 Moving Average has acted as resistance, so there's a "V-Top" pattern. In this case, we could have a decline towards the nearest support at 1.3799 - 1.3763. If a pullback from this area forms little later on, there'll be a moment to have another bullish price movement.

UserPostedImage

The price is consolidating between the Moving Averages. The main intraday target is the closest support at 1.3799 - 1.3763. If we have a pullback from these levels, bulls will probably try to test the next resistance at 1.3875 - 1.3904.

More:
https://goo.gl/CKTihq 
riki143
  • Posts: 1104
  • Joined: 15/08/2017
EUR/USD Daily Analytics
12:30 06.03.2018

UserPostedImage

We've got a bearish "Harami" pattern, which hasn't been confirmed yet. So, if a pullback from the Moving Averages happens little later on, there'll be an opportunity to have a new local high. Meanwhile, if we have another reversal pattern, bears will probably try to deliver a downward correction.

UserPostedImage

There're bearish patterns such a "High Wave" and a "Shooting Star", which both have been confirmed. In this case, the Moving Averages is likely going to act as support anytime soon.

More:
https://goo.gl/A3Rf3N 
riki143
  • Posts: 1104
  • Joined: 15/08/2017
USD/JPY Daily Analytics
12:35 06.03.2018

UserPostedImage

There's a bearish "Harami", which has been formed on the 21 Moving Average. So, the market is likely going to decline towards the nearest support area in the short term.

UserPostedImage

The last "Shooting Star" led to the current decline. Also, there's a pullback from the 89 Moving Average. Therefore, the price is likely going to decline in the coming hours.

More:
https://goo.gl/PqBT2d 
riki143
  • Posts: 1104
  • Joined: 15/08/2017
USD/CHF Daily Analytics
07:44 07.03.2018
Recommendation:

SELL 0.9325 SL 0.938 TP1 0.9255 TP2 0.9220

BUY 0.9475 SL 0.9420 TP1 0.9610 TP2 0.9715 TP3 0.9780

On the daily chart of USD/CHF, bulls need to rise above resistance at 0.9475 and trigger the “Shark” pattern. This is a signal of their weakness. Currently, bulls and bears are fighting for 0.9380. The further face of franc depends on the result of this battle.

UserPostedImage

On H1, the decline of USD/CHF below support at 0.9340 and 0.9325 allows triggering the “Shark” pattern and AB=CD. Their 88.6% and 200% targets correspond to 0.9255 and 0.9220.

UserPostedImage

More:
https://goo.gl/8V4KU8 
riki143
  • Posts: 1104
  • Joined: 15/08/2017
GBP/USD Daily Analytics
08:16 07.03.2018
Recommendation:

SELL 1.3975

SL 1.4030

TP1 1.3875 TP2 1.384 TP3 1.3795

On the daily chart, GBP/USD bulls are ready to make another attempt to test the upper border of the downtrend channel. If the pair managed to break above this line, an inverted “Shark” pattern with target at 88.6% will be triggered. On the other hand, a pullback will return the initiative to bears.

UserPostedImage

On H1, GBP/USD is fighting for 1.39. The inability of bulls to move above this level will point at their weakness. The risks of decline to 88.6% of the “Bat” will increase.

UserPostedImage

More:
https://goo.gl/UQuihg 
riki143
  • Posts: 1104
  • Joined: 15/08/2017
EUR/USD Daily Analytics
07:53 07.03.2018
Technical levels: support – 1.2380, 1.2350; resistance – 1.2450, 1.2480.

Trade recommendations:

Sell — 1.2450; SL — 1.2480; TP1 — 1.2380; TP2 — 1.2350
Reason: narrowing bearish Ichimoku Cloud with rising Senkou Span A; a golden cross of Tenkan-sen and Kijun-sen with rising lines; the prices are in the positive area, but there is a strong resistance on 1.2450.

UserPostedImage

More:
https://goo.gl/JRbZWz 
riki143
  • Posts: 1104
  • Joined: 15/08/2017
GBP/USD Daily Analytics
07:54 07.03.2018
Technical levels: support – 1.3820; resistance – 1.3930.

Trade recommendations:

Sell — 1.3870; SL — 1.3890; TP1 — 1.3820; TP2 — 1.3770.
Reason: narrowing bearish Ichimoku Cloud with rising Senkou Span A; a golden cross of Tenkan-sen and Kijun-sen; a market reached the resistance of the Cloud’s bottom border.

UserPostedImage

More:
https://goo.gl/Hph98p 
riki143
  • Posts: 1104
  • Joined: 15/08/2017
EUR/USD Daily Analytics
10:48 07.03.2018

UserPostedImage

The main trend is still bullish, but the pair faced with resistance at 1.2359, so there's consolidation. Nevertheless, it's likely that the market is going to continue moving up towards the next resistance at 1.2474 - 1.2509. If a pullback from this area happens little later on, there'll be a moment to have a decline.

UserPostedImage

The price is consolidating between the levels 1.2334 - 1.2391. It's likely that the pair is going to reach the closest support at 1.2391 - 1.2368. Meanwhile, if we see a pullback from these levels, bulls will probably try to test another resistance at 1.2434 - 1.2474.

More:
https://goo.gl/kmd8SS 
riki143
  • Posts: 1104
  • Joined: 15/08/2017
GBP/USD Daily Analytics
10:50 07.03.2018

UserPostedImage

There's a "Double Top" pattern, which has been formed on the Moving Averages. So, we should keep an eye on the nearest support at 1.3856 - 1.3799 as the next bearish target. If a pullback from this area happens, we could have another upward price movement.

UserPostedImage

We've got two bearish "Thorn" patterns on the one-hour chart. Therefore, there's an opportunity to have a downward correction towards the closest support area at 1.3816 - 1.3799 in the short term.

More:
https://goo.gl/Axg2vz 
riki143
  • Posts: 1104
  • Joined: 15/08/2017
EUR/USD Daily Analytics
12:55 07.03.2018

UserPostedImage

There's a "Three Methods" pattern, which has been confirmed. Also, there's no any reversal pattern, so the market is likely going to test the next resistance area. If a pullback from this zone happens little later on, there'll be a moment for a bearish correction.

UserPostedImage

We've got a bearish "Shooting Star" right under the upper "Window". In this case, there's an opportunity to have a local correction towards the nearest support, which could be a departure point for another bullish price movement.

More:
https://goo.gl/5ac2N5 
riki143
  • Posts: 1104
  • Joined: 15/08/2017
USD/JPY Daily Analytics
12:57 07.03.2018

UserPostedImage

The 21 Moving Average has acted as resistance, so the price is declining. The main bearish target is the lower "Window". If a pullback from this level happens, we could have an upward correction afterwards.

UserPostedImage

There's a bullish "Hammer", so there's an opportunity to have a local upward correction. Meanwhile, if a pullback from the Moving Averages happens little later on, bears will probably try to deliver a new local low.

More:
https://goo.gl/k71eeR 
riki143
  • Posts: 1104
  • Joined: 15/08/2017
AUD/USD Daily Analytics
06:30 08.03.2018
Technical levels: support – 0.7760; resistance – 0.7840

Trade recommendations:

Sell — 0.7820; SL — 0.7840; TP1 — 0.7760; TP2 — 0.7700.
Reason: bearish Ichimoku Cloud, but rising Senkou Span A; a golden cross of Tenkan-sen and Kijun-sen with rising Tenkan-sen; the prices are inside a Cloud and there is a strong resistance of Senkou Span B.

UserPostedImage

More:
https://goo.gl/Yx5JVa 
riki143
  • Posts: 1104
  • Joined: 15/08/2017
USD/JPY Daily Analytics
06:32 08.03.2018
Technical levels: support – 105.80; resistance – 106.20.

Trade recommendations:

Sell — 105.70; SL — 105.90; TP1 — 105.00; TP2 — 104.50.
Reason: bearish Ichimoku Cloud with horizontal Senkou Span A and B; a new weak golden cross of Tenkan-sen and Kijun-sen, the lines are horizontal; the market is in consolidation near Tenkan-sen and Kijun-sen, but may continue downtrend.

UserPostedImage

More:
https://goo.gl/JBKQBy 
riki143
  • Posts: 1104
  • Joined: 15/08/2017
EUR/JPY Daily Analytics
06:54 08.03.2018
Recommendation:

SELL 133.40 SL 133.95 TP1 132.40 TP2 131.30

SELL 134.20 SL 134.75 TP1 133.20 TP2 132.40 TP3 131.30

On the daily chart, EUR/JPY after reaching 113% target of the “Shark” made a natural pullback. Now it’s transforming into 5-0. Usually, correction towards 50% of the wave CD is used for selling.

UserPostedImage

On H1 of EUR/JPY, a break of resistance at 132 will trigger the “Shark” and increase the odds of the “Wolfe waves” pattern. The target of the later will allow finding a convergence area 134.15-134.3.

UserPostedImage

More:
https://goo.gl/caofvb 
riki143
  • Posts: 1104
  • Joined: 15/08/2017
USD/JPY Daily Aalytics
07:03 08.03.2018
Recommendations:

SELL 106.8 SL 107.35 TP1 105.8 TP2 105.35 TP3 103.00

SELL 105.35 SL 105.90 TP1 104.35 TP2 103.35 TP3 103.00

On the daily chart of USD/JPY, there’s a sustainable downtrend. As long as the pair is below 107.9-108.2, bears are in control. A break of support at 105.35 will increase the risks of decline to 161.8% target of AB=CD and convergence area of 102.8-103.2.

UserPostedImage

On H1, the inability of bulls to keep the pair above the upper border of the triangle and reach 78.6% of the Gartley pattern is a signal for selling.

UserPostedImage

More:
https://goo.gl/87jBJ7 
Users browsing this topic
  • Guest (3)
Forum Jump  
  • You cannot post new topics in this forum.
  • You cannot reply to topics in this forum.
  • You cannot delete your posts in this forum.
  • You cannot edit your posts in this forum.
  • You cannot create polls in this forum.
  • You cannot vote in polls in this forum.