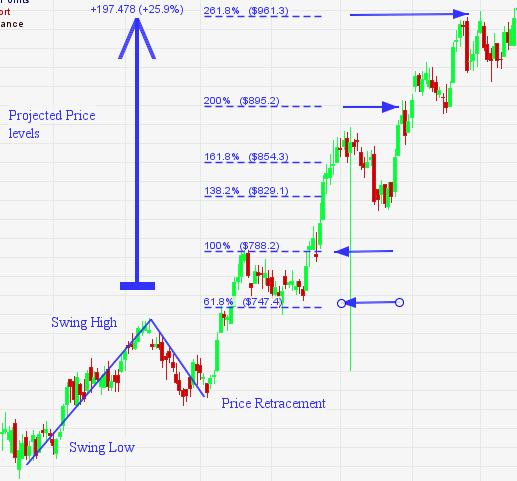
Fibonacci Projection Forex indicator is a useful tool, Metatrader avails many tools to assist Forex traders in currency trading. Fibonacci price projection comes in the list of those tools that if applied correctly can give healthy returns on the fund invested by a trader in the Forex market. Correct application of Fibonacci price projection is required to earn profit . If this tool is not correctly applied then this can be a main reason of loss. Intermediate traders and novices may not apply Fibonacci price projection tool correctly because of lack of knowledge. Price projection tools may only give a possible target for any currency and that may be right or wrong because it depends on the rising or falling market trend. There are two types of Fibonacci price projection techniques, external projection and internal projection. Fxstay team recommend using Fibonacci projection indicator.
Internal Fibonacci Projection Forex IndicatorInternal Fibonacci projections show Fibonacci retracement. Fibonacci retracement can be seen when price level retraces a past trend in a certain ration. The most common ratios are 38.2%, 50% and 61.8%. Excellent stop loss levels are seen in Fibonacci retracement.
External Fibonacci Projection Forex IndicatorExternal Fibonacci projections include three studies namely Fibonacci expansions, extension and alternates or parallels. First common thing in all the three studies is that all three allow a trader to forecast price reversal levels existing outside the range of previous trends. This is the reason why external Fibonacci projection is an ideal method for deciding profit levels. The second common thing in all three studies show trend continuation of any previous trend after price retracement has occurred.
The first difference among all three studies of external Fibonacci projection is the process that is used for calculation and the second difference in all three studies is the Fibonacci ratios that are used in each study.
Fibonacci ExtensionsThe calculation of Fibonacci extensions depends on the range of a previous trend observed after price retraces. Most observed Fibonacci ratios are applied on the observed range. These ratios are 100%, 138.2% and 161.8%. The resultant values that are obtained after calculation are then summed up with most extreme point that has occurred before the retracement. The result of this addition shows the future price levels.
Fibonacci ExpansionsThe calculation of Fibonacci expansions depends on the range of price retracement move occurring after the trend. This range is calculated by taking the difference of two extreme points and then most observed Fibonacci ratios are applied on the resultant. These ratios are 100%, 138.2%, 161.8%, 200% and 261.8%. The resultant values that are obtained after calculation are then summed up with most extreme point that has occurred before the most extreme pivot occurring previous to the retracement. The result of this addition shows the future price levels.
Fibonacci Alternates or ParallelsThe calculation of Fibonacci alternates or parallels depends on the range of a previous trend that has occurred before a price retracement. After determining the range of a previous trend, the most observed Fibonacci ratios are applied. These ratios are 138.2%, 161.8% and 200%. The resultant values that are obtained after calculation are then summed up with the pivot.
An example below shows the Fibonacci projection in uptrend.

Using Fibonacci projection, Forex traders can produce several price levels and all of which have high probability to occur and act like future price reversal levels.