LandOfCash Forex expert advisors, Trailing EA, Indicators.

Forex Trading Expert Advisors (EA or automated trading system) and Custom Indicators (CI) for MetaTrader Platform.

LOCTrailing With Partial Close Expert Advisor protect your orders profit. Trail stop level for manual and automatic orders with different algorithms, move stop loss into breakeven.

LOCInfo Custom Indicator follow the simple rules and make the right decision when to buy or sell. View Moving Average, Stochastic indicators from multiple time frames in one place.

riki143
  • Posts: 1104
  • Joined: 15/08/2017
EUR/USD Daily analyics
14:28 03.04.2018

UserPostedImage

The 34 & 55 Moving Averages acted as resistance, so there's a bearish 'Shooting Star' pattern. Also, there's a bearish 'Three Methods', so the market is likely going to continue falling down in the short term.

UserPostedImage

There's a 'Shooting Star' pattern, which has been formed on the 144 Moving Average. In this case, we should keep an eye on the lower 'Window' as a possible intraday target

More:
https://tinyurl.com/ycup577d 
riki143
  • Posts: 1104
  • Joined: 15/08/2017
USD/JPY Daily Analytics
14:33 03.04.2018

UserPostedImage

We've got a bullish 'Hammer', which has been confirmed. Also, there's no any reversal pattern so far, which means the price is going to continue rising in the direction of the 144 Moving Average.

UserPostedImage

The last bullish 'Harami' led to the current upward price movement. Meanwhile, if a pullback from the nearest resistance happens little later on, there'll be an opportunity to have a local correction.

More:
https://tinyurl.com/ycup577d 
riki143
  • Posts: 1104
  • Joined: 15/08/2017
AUD/USD Daily Analytics
06:25 04.04.2018
Technical levels: support – 0.7610, 0.7690; resistance – 0.7730

Trade recommendations:

Sell — 0.7730; SL — 0.7750; TP1 — 0.7610; TP2 — 0.7580.
Sell — 0.7680; SL — 0.7710; TP1 — 0.7610; TP2 — 0.7580.
Reason: narrowing bearish Ichimoku Cloud with rising Senkou Span A; a cancelled golden cross of Tenkan-sen and Kijun-sen; the prices are had entered into the cloudy area.

UserPostedImage

More:
https://tinyurl.com/y7nc9hs3 
riki143
  • Posts: 1104
  • Joined: 15/08/2017
USD/JPY Daily Analytics
06:27 04.04.2018
Technical levels: support – 106.30; resistance – 106.70, 107.30.

Trade recommendations:

Sell — 107.30; SL — 107.50; TP1 — 106.30; TP2 — 106.00.
Reason: narrow bullish Ichimoku Cloud with falling Senkou Span A; a cancelled dead cross of Tenkan-sen and Kijun-sen; the market had returned into the positive area, but there is a strong resistance on 107.30.

UserPostedImage

More:
https://tinyurl.com/y95syw4k 
riki143
  • Posts: 1104
  • Joined: 15/08/2017
USD/CAD Daily Analytics
06:54 04.04.2018
Recommendation:

SELL 1.2770

SL 1.2825

TP1 1.2690 TP2 1.2570

On the daily chart of USD/CAD, after a short consolidation in the 1.2810-1.2950 range bulls manage to pull the pair above its lower border and trigger the “Shark” pattern with a target at 88.6%. The necessary condition for the further decline is the fall below support at 1.2685-1.2715.

UserPostedImage

On H1, a break of support at 1.2815 with its following retest triggered the “Spike and ledge”, “Shark” and AB=CD. The targets of the last two at 113% and 224% are at 1.2570 and 1.2690.

UserPostedImage

More:
https://tinyurl.com/y7547xvd 
riki143
  • Posts: 1104
  • Joined: 15/08/2017
GBP/USD Daily Analytics
09:22 04.04.2018
Recommendations:

BUY 1.4195

SL 1.414

TP1 1.4295 TP2 1.443 TP3 1.4515

On the daily chart of GBP/USD, a correction within the “Shark” pattern’s transformation to 5-0 ended at the level of 38.2% from the CD wave. To resume the uptrend bulls should break the resistance at 1.4122. As a result, odds of 113% and 127.2% targets of “Shark” and “AB=CD” patterns will increase.

UserPostedImage

On H1, after the pair reached the first target of the “Wolfe waves” pattern a natural pullback happened. To continue the rally, bulls should break the resistance at 1.4195.

UserPostedImage

More:
https://tinyurl.com/yd6xlxrw 
riki143
  • Posts: 1104
  • Joined: 15/08/2017
XAU/USD Daily Analytics
09:25 04.04.2018
Recommendations:

BUY 1345

SL 1330

TP1 1374 TP2 1394

On the daily chart of XAU/USD, bears are trying to form the “Shakeout-Fakeout” pattern as the pair could not break the upper boundary of 1302-1340 consolidation. To implement it the pair has to break the support at 1321. Vice versa, the hit of resistances at 1340 and 1345 will let bulls to hope on the continuation of the rally to 113% and 127.2% targets of “Shark” and “AB=CD” patterns.

UserPostedImage

On H1, the implementation of the “Butterfly” pattern will increase risks of the sharp decline. To resume the uptrend bulls should break the resistance at 1345.

UserPostedImage

More:
https://tinyurl.com/y9h5vfca 
riki143
  • Posts: 1104
  • Joined: 15/08/2017
EUR/USD Daily Analytics
11:34 04.04.2018

UserPostedImage

There's a 'Double Bottom' pattern, but the price remains under the Moving Averages. The main intraday target is the nearest resistance at 1.2335 - 1.2344, which could be a departure point for another decline.

UserPostedImage

The 55 Moving Average acted as resistance, so there's a 'Thorn' pattern. In this case, the pair is likely going to test the closest support at 1.2272 - 1.2253. If we have a pullback from this area, there'll be a moment for an upward price movement.

More:
https://tinyurl.com/y8hyfcom 
riki143
  • Posts: 1104
  • Joined: 15/08/2017
GBP/USD Daily Analytics
11:36 04.04.2018

UserPostedImage

The main trend is still bullish, but the market is consolidating along the Moving Averages. It's likely that the pair is going to test the next resistance at 1.4144. However, if a pullback from this level happens little later on, there'll be a moment for a decline towards the 89 Moving Average.

UserPostedImage

The price is consolidating between the levels 1.3982 - 1.4095. The main intraday target is the closest support at 1.4049 - 1.4027, which could be a starting point for a bullish price movement in the direction of the next resistance at 1.4133 - 1.4144

More:
https://tinyurl.com/ybbqq799 
riki143
  • Posts: 1104
  • Joined: 15/08/2017
USD/JPY Daily Analytics
12:41 04.04.2018

UserPostedImage

There's a bearish 'Tower' pattern, which has been confirmed. Therefore, the market is likely going to test the nearest support once again. A pullback from this area could be a starting point for an upward price movement.

UserPostedImage

We've got a bearish 'Engulfing' and 'Harami' patterns, so the pair is declining. It's likely that the price is going to reach the next support area in the coming hours.

More:
https://tinyurl.com/ya337euw 
riki143
  • Posts: 1104
  • Joined: 15/08/2017
EUR/JPY Daily Analytics
06:38 05.04.2018
Recommendation:

BUY 131.80

SL 131.25

TP1 132.80 TP2 133.20 TP3 136.70

On H1, EUR/JPY is consolidating in the 129.15-132.15 range within the “Spike and ledge” pattern. A break of its upper border will increase the risks of a “Shark” pattern with a target at 88.6%. It corresponds to 136.7.

UserPostedImage

On H1 of EUR/JPY, the inability of bears to return the pair inside the downtrend channel points at their weakness. A successful test of resistance at 131.8 will open the way up to targets of “Wolfe waves” and “Shark”.

UserPostedImage

More:
https://tinyurl.com/ybqz8r45 
riki143
  • Posts: 1104
  • Joined: 15/08/2017
EUR/USD Daily Analytics
07:35 05.04.2018
Technical levels: support – 1.2150, 1.2250; resistance – 1.2300.

Trade recommendations:

Sell — 1.2240; SL — 1.2260; TP1 — 1.2180; TP2 — 1.2150
Reason: expanding bearish Ichimoku Cloud with falling Senkou Span A; a new dead cross of Tenkan-sen and Kijun-sen with the falling Tenkan-sen and Kijun-sen; the market returned to 3-W lows again.

UserPostedImage

More:
https://tinyurl.com/yaent5uk 
riki143
  • Posts: 1104
  • Joined: 15/08/2017
GBP/USD Daily Analytics
07:37 05.04.2018
Technical levels: support – 1.4040/50; resistance – 1.4140.

Trade recommendations:

Buy — 1.4060; SL — 1.4040; TP1 — 1.4140; TP2 — 1.4170.
Reason: bullish Ichimoku Cloud with horizontal Senkou Span A and B; a weak golden cross of Tenkan-sen and Kijun-sen with horizontal lines; the prices are on the support of Kijun-sen.

UserPostedImage

More:
https://tinyurl.com/yavxxubh 
riki143
  • Posts: 1104
  • Joined: 15/08/2017
USD/CHF Daily Analytics
07:45 05.04.2018
Recommendations:

BUY 0.958

SL 0.9525

TP1 0.968 TP2 0.974 TP3 0.979

On the daily chart of USD/CHF, bulls managed to push the pair out of the long-term downtrend channel and implement the “AB=CD” pattern with the 224% target. To continue the rally, the pair should break the resistance at 0.9811.

UserPostedImage

On H1, the “Spike and reversal with acceleration” pattern is implemented. The bullish trend will continue until the pair falls below the bottom boundary of the uptrend. Pullbacks to supports at 0.958 and 0.9555 may be used for long positions.

UserPostedImage

More:
https://tinyurl.com/ya5x4qac 
riki143
  • Posts: 1104
  • Joined: 15/08/2017
USD/JPY Daily Analytics
07:48 05.04.2018
Recommendations:

BUY 107.00

SL 106.45

TP1 107.85 TP2 108

On the daily chart of USD/JPY, after the pair reached the 127.2% target of the “AB=CD” pattern there is a correction to the downtrend. Bulls are trying to implement the “Wolfe waves” pattern and push the pair at least to the resistance at 108 (23.8% from the long-term bearish wave).

UserPostedImage

On H1, if the pair hits the resistance at 107, the “AB=CD” pattern with the 161.8% target will be implemented and odds of the rise to targets of “Shark” (113%) and “Wolfe waves” patterns will increase.

UserPostedImage

More:
https://tinyurl.com/y7rxwz96 
riki143
  • Posts: 1104
  • Joined: 15/08/2017
EUR/USD Daily Analytics
10:09 05.04.2018

UserPostedImage

Bears faced with support at 1.2250, so the pair is consolidating. The main intraday target is the next support at 1.2239, which could be a departure point for another upward price movement towards the nearest resistance at 1.2285 - 1.2335.

UserPostedImage

There's a 'V-Bottom', so the market is likely going to reach the 55 Moving Average. However, if this line acts as resistance, bears will probably try to test the closest support at 1.2233.

More:
https://tinyurl.com/ydcmgthm 
riki143
  • Posts: 1104
  • Joined: 15/08/2017
GBP/USD Daily Analytics
10:12 05.04.2018

UserPostedImage

The price is consolidating between the 34 & 55 Moving Averages. Also, there's a 'Flag' pattern, so the pair is likely going to test the closest support at 1.3982 - 1.3228. Meanwhile, if a pullback from this area forms little later on, there'll be a moment for an upward price movement in the direction of the next resistance at 1.4096 - 1.4144.

UserPostedImage

There's a consolidation, which is taking place between the levels 1.4010 - 1.4096. It's likely that the pair is going to test the nearest resistance at 1.4069 - 1.4096. A pullback from these levels could be a starting point for a bearish price movement towards another support at 1.4027 - 1.4010.

More:
https://tinyurl.com/ybfd2ym3 
riki143
  • Posts: 1104
  • Joined: 15/08/2017
EUR/USD Daily Analyics
13:49 05.04.2018

UserPostedImage

There's still no any reversal pattern so far, which means the pair is likely going to continue declining. However, if a pullback from the nearest support area forms little later on, there'll be an opportunity to have an upward correction.

UserPostedImage

We've got a bearish 'Engulfing' pattern, which has been confirmed. So, the market is likely going to continue declining in the direction of the lower 'Window'.

More:
https://tinyurl.com/y7lu4z3g 
riki143
  • Posts: 1104
  • Joined: 15/08/2017
USD/JPY Daily Analytics
13:53 05.04.2018

UserPostedImage

The last bullish 'Hammer' led to the current upward price movement. However, if we have a pullback from the nearest resistance area, there'll be time for a bearish correction towards the Moving Averages.

UserPostedImage

There's a 'Gravestone Doji', which has been formed at the last local high. Meanwhile, if a pullback from the closest support forms in the coming hours, bulls are likely going to deliver a new local high.

More:
https://tinyurl.com/y7q98jge 
riki143
  • Posts: 1104
  • Joined: 15/08/2017
APRIL OUTLOOK ON THE FX MARKET
15:06 05.04.2018
Trade wars tensions are creating a high volatility in the FX market. Risk-on and risk-off sentiments make currencies rise and fall. However, not only trade wars affect the market. There are a lot of events that will support and weight on currencies this month.

We offer you a short outlook on April events.

USD

US steel and aluminum tariffs exacerbate further what are already tense ties between markets. The US tariffs met retaliations from other countries. For example, China enacted charges on 128 US goods. As a result, tensions between two largest world’s economies put pressure not only on the US dollar and Chinese yuan but also on the Australian dollar, Canadian dollar and Japanese yen.

The US dollar had been suffering from volatility for the previous month.

Besides trade wars issue, NAFTA negotiations were a driver of the greenback’s movement.

According to talks, Mr. Trump plans to agree on a previous version of the new NAFTA agreement to the middle of April. If negotiations are successful, it will support not only the greenback but Canadian dollar too. Pay attention to the Eighth Summit of the Americas that will be held on April 13 and 14, 2018. There is a high possibility that NAFTA parties will discuss the agreement there.

As you know, the Fed raised an interest rate in March. To assess a result of that decision, investors will look at inflation data (CPI m/m and Core CPI m/m on April 11 at 15:30 MT time). The Fed is anticipated to lift the interest rate at least 2 times this year, so the CPI figures will display if there is any reason to increase it to 3 times.

JPY

In March Haruhiko Kuroda was reappointed as the BOJ Governor. Mr. Kuroda is famous for his dovish policy. As a natural result, the Bank of Japan is anticipated to keep an interest rate on hold, that puts pressure on the yen.

Last month the USD/JPY pair fell to 104.625, so the yen reached new highs that is not good for the Japanese economy. Tankan manufacturing index and non-manufacturing index data appeared to be weaker for the first time in two years. Large Japanese manufacturers displayed a concern because of the strong yen as it negatively affects manufacturers.

An important event for this month is the BOJ policy rate on April 27. The possibility of the rate hike is still low as firstly the central bank has to taper its quantitative easing policy. However, the Governor may give some clues on the future monetary policy.

EUR

Trade wars covered not only Chinese and American economies but the European as well. After Trump’s move, the European Union claimed that it is going to impose 25% tariffs on $3.5 billion of American goods. So the previous month was risky for the euro.

The beginning of a new quarter appeared to be difficult for the European currency as well.

The European central bank has hinted on the soon quantitative easing tapering. Let’s look at the interest rate announcement on April 26 at 14:45 MT time. Mario Draghi may give prompts on the monetary policy.

GBP

The pound is showing good results. The UK currency managed to rise based on the positive economic data. However, March was not easy for the currency. Its rate highly depended on the Brexit negotiations. This month will not be an exclusion. If parties find areas of common interest, talks could start.

AUD

In March the Australian dollar plunged to the level of December 2017. The beginning of April is quite positive for the aussie but as you know, a positive trend cannot continue forever. Rate hikes always support domestic currencies. However, as we know the Reserve Bank of Australia does not plan to raise the interest rate until the end of 2018 that can have a negative impact on the aussie.

The RBA explains its decision at the meeting minutes. Follow monetary policy meeting minutes on April 17 at16:30 MT time.

Moreover, the Australian inflation is still below its target of 2-3%. Let’s look at the CPI q/q on April 24 at 4:30 MT time.

NZD

The New Zealand dollar tightly correlated with the US dollar and the Australian dollar.

The second quarter of this year began on a positive note for the New Zealand dollar. This month we do not anticipate a lot of crucial data from New Zealand. However, to predict the kiwi’s direction, you should pay attention to the US economic data. Moreover, follow trade wars news to predict the kiwi’s movement.

CAD

The environment of uncertainty around NAFTA negotiations affected the Canadian dollar. Canada was excluded from the US tariffs, however, it could not prevent the loonie from volatility. If NAFTA’s parties hammer out a deal this month, trade wars tensions will decline, the Canadian dollar will be able to rise.

Canada is one of the top oil producers in the world. So the loonie highly depends on the oil prices. When oil prices go up, the Canadian dollar rises. The OPEC and its allies are trying to control the oil output, however, US crude oil inventories put pressure on the oil market. As soon as the amount of US producers rise, the oil prices decline. The continuation of such rise will negatively affect the market and the Canadian dollar too.

There is a low chance that the Bank of Canada will increase the interest rate this month, however, Governor’s comments are highly important. Look at the BOC monetary policy report at 17:00 MT time on April 18.

Making a conclusion, we highly recommend you to follow the trade wars news to get ideas of the general currencies movement. Furthermore, do not forget about economic data that are crucial for your fundamental analysis.

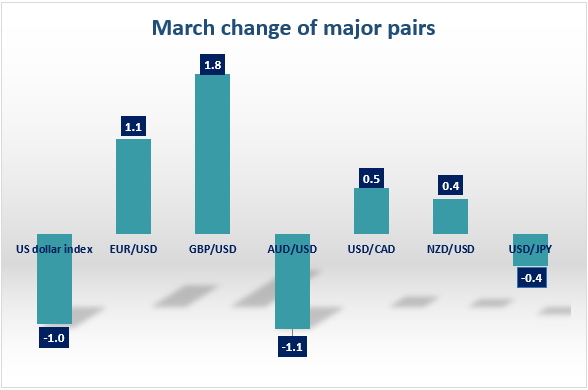
Extra: monthly change of the major currency pairs
UserPostedImage

More:
https://tinyurl.com/ybjr73ma 
riki143
  • Posts: 1104
  • Joined: 15/08/2017
AUD/USD Daily Analytics
07:05 06.04.2018
Technical levels: support – 0.7610, 0.7660; resistance – 0.7690

Trade recommendations:

Sell — 0.7650; SL — 0.7670; TP1 — 0.7580; TP2 — 0.7530.
Reason: expanding bearish Ichimoku Cloud with falling Senkou Span A; a golden cross of Tenkan-sen and Kijun-sen, but the prices are had entered into the negative area.

UserPostedImage

More:
https://tinyurl.com/y966mvz7 
riki143
  • Posts: 1104
  • Joined: 15/08/2017
USD/JPY Daily Analytics
07:07 06.04.2018
Technical levels: support – 106.80; resistance – 107.50.

Trade recommendations:

Sell — 107.50; SL — 107.70; TP1 — 106.80; TP2 — 106.30.
Reason: bullish Ichimoku Cloud with horizontal Senkou Span A and B; a golden cross of Tenkan-sen and Kijun-sen, but the lines are horizontal; the market is overbought and under the strong daily resistance.

UserPostedImage

More:
https://tinyurl.com/y9gsed4f 
riki143
  • Posts: 1104
  • Joined: 15/08/2017
EUR/USD Daily Analytics
07:30 06.04.2018
Recommendation:

SELL 1.2315 SL 1.237 TP1 1.2215 TP2 1.2095 TP3 1.205

SELL 1.2215 SL 1.227 TP1 1.2115 TP2 1.2095 TP3 1.205

On the daily chart of EUR/USD, bears made the first attempt to pull the pair below support at 1.2245. As a result, it formed the junior pattern “Widening wedge”. To continue the decline the pair has to fall below April minimum.

UserPostedImage

On H1, there’s a “Widening wedge”. Pullbacks to 23.8%, 38.2% and 50% as usually are used for selling with targets at 78.6% of the Gartley pattern. At the same time, advance above 1.2417 will increase the odds of uptrend’s resumption.

UserPostedImage

More:
https://tinyurl.com/y8y5lbwl 
riki143
  • Posts: 1104
  • Joined: 15/08/2017
EUR/GBP Daily Analytics
07:40 06.04.2018
Recommendation:

SELL 0.8715

SL 0.8770

TP1 0.8615 TP2 0.8590

On the daily chart, EUR/GBP keeps forming a 5-0 pattern. After a pullback to 38.2% of the wave CD of the “Shark” pattern, the initiative returned to bears. At the moment, the inside bars are formed. They point at uncertainty.

UserPostedImage

On H1, EUR/GBP is consolidating in the 0.8715-0.8755 range. A break of its lower border will create grounds for a “Crab” pattern with a target of 161.8%. On the other hand, successful test of resistance at 0.8755 will increase the risks of a correction.

UserPostedImage

More:
https://tinyurl.com/ya5774hh 
Users browsing this topic
  • Guest
Forum Jump  
  • You cannot post new topics in this forum.
  • You cannot reply to topics in this forum.
  • You cannot delete your posts in this forum.
  • You cannot edit your posts in this forum.
  • You cannot create polls in this forum.
  • You cannot vote in polls in this forum.