Hi pip makers, we all know there are three type of analysis in trading. I know you guys well aware of these three things but I have to go through once again so please bear with me till the point of my new and sweet points.
* Technical analysis
* Fundamental analysis
* Sentimental analysis
Technical analysis is studying statistics and patterns generated by market activity in the past prices and volume.
Fundamental analysis is studying everything from the overall economy and industry conditions to the financial condition and management of companies (Assume one country as one company).
Sentiment analysis is a type of forex analysis that focuses on identifying and measuring the overall psychological state of all participants in the market.
Nowadays we combine all then to do trading. But the trading community didn't accept technical analysis as a viable tool for making money until the late 1970s or early 1980s. But according to me I can trade and make good profit with the help of technical analysis without analyzing fundamental and sentimental because technical will show the effect of fundamental in the means of price movement and volume but we need to closely look in to it to identity the effect in technical analysis itself. The one who identifies and relate to previous history and trade, he will be winner and same goes with sentimental. But also we have to consider all the analysis to escape from the bad trade because human focus is not exactly 100 every time
Many people think Technical analysis does not analyze fundamental data like economic numbers and news but as such its 3 major objectives are as follows:
1.Alert: Alert the trader to a possible trend.
2.Predict: Present probabilities of the direction of future price moves.
3.Confirm: To confirm patterns suggested by other indicators or analysis methods.
A candlestick chart (also called Japanese candlestick chart) is a style of financial chart used to describe price movements of a security, derivative, or currency.
Candlestick patterns are one type of technical analysis. Now I am going to explain about four candlestick patterns which are used to identify trend reversal.
The famous four trend reversal candlestick patterns are:
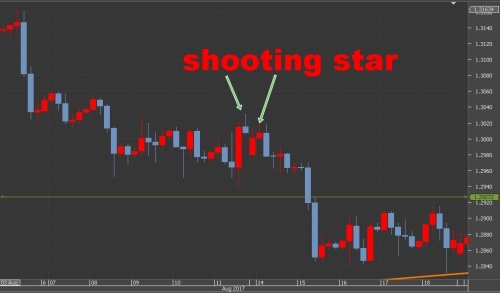
1) Shooting star
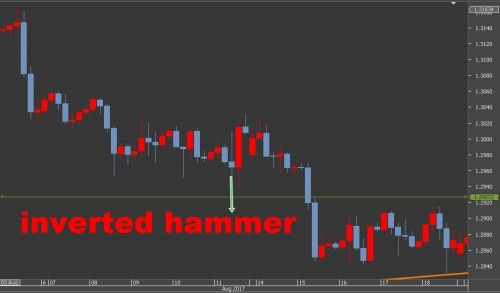
2) Inverted hammer
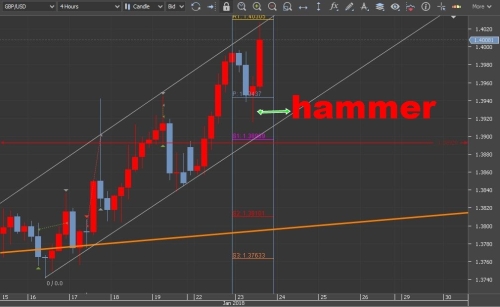
3) Hammer
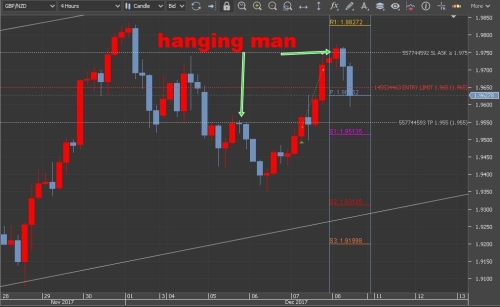
4) Hanging man
I love to trade based on candlestick pattern trading especially above four candlesticks. This candlestick patterns works 90% accurate in 4 hr chart. I used different times and tried from past 18 months so from my experience these 4 candlestick pattern gives good results in 4 hour chart. i am showing some examples those where i made a profit in the past
Shooting star: The shooting star candlestick is a chart formation consisting of a candlestick with a small real body, and a large upper shadow. Lets consider below GBP/USD chart in 4 hours and take a close look in to marked section and I made around 40 pips with the help of shooting star and if you look in to history same goes with it and one good thing is you can easily identify the fake shooting star easily but you need to practice to do so.
 Inverted hammer
: the inverted hammer candlestick is a chart formation, has a long upper shadow and a short body at the bottom of the candlestick with little or no lower shadow. Let’s consider below GBP/USD 4 hour chart and take a close look in to marked section and with the help of inverted hammer I made easily 50-80 pips and I used to place the trade in night and by morning my trade used to close in profit around 90% of the time.
 Hammer
: the hammer candlestick is a chart formation, has a long lower wick and a short body at the top of the candlestick with little or no upper shadow. Be careful and don’t assume the hammer for yourself and make sure all the rules applies then only consider and if you find difficulties to confirm then better to trade those hammers.
 Hanging man
: the hanging man is a chart formation consisting of a candlestick with a small real body, and a large lower shadow. I want to say one more important thing this 4 candle stick reversal pattern works much better with GBP/USD chart compare to other and use only major pairs.
 Conclusion
I showed some examples in the above charts, with that if you use oscillators like RSI and stochastic, it may help more and miss the bad and fake signals. We have to consider all the analysis to increase the winning probabilities of our trade.
