We'd be surprised if the title did not raise a few eyebrows! Opening points? Well, we can tell you that we're not referring to pivot point levels. This is a common method. Just type 'Pivot points forex' into Google search, and you'll be inundated with information.
The approach we're going to show here, as far as we can see, is not widely used. Just to be clear though, this technique was not developed by us in any way shape or form. We've simply found credibility in these lines and use them to our advantage.
Yearly, monthly and weekly opening points?Put simply, these are price points extended into the future from the opening candle of each year, month and week, similar to how you'd plot a typical support/resistance level. Irrespective of the timeframe being traded, however, we always look to draw lines from the opening candle on the hourly chart. This helps locate the exact opening value.
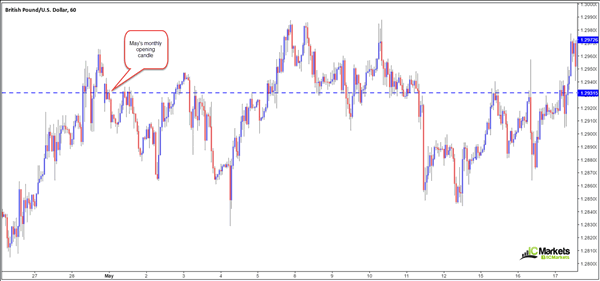
The level can then be used on the M1 right up to the monthly timeframe. The chart below shows a good example of a Monthly opening level used in May. Notice that we've attached the line to the OPEN of the candle. The high, low and close are not important here.
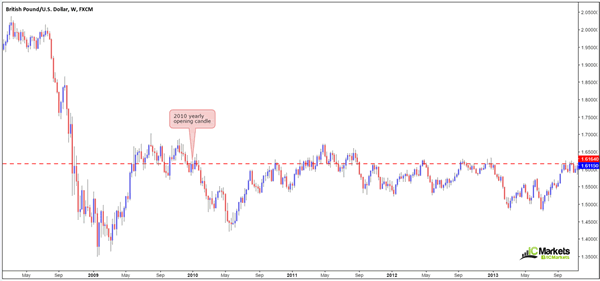
Below is another example. This time, nevertheless, we've taken it from the 2010 yearly open. Once again, the line was drawn using the open candle found on the hourly chart.
 Why do these levels usually hold?
Technically, we have confidence in these levels due to years of back testing. Attached below are three charts, two of which were used above showing this in action:
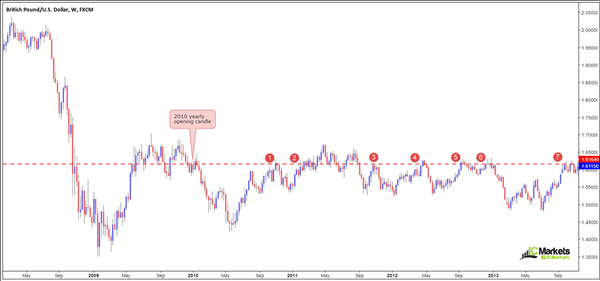
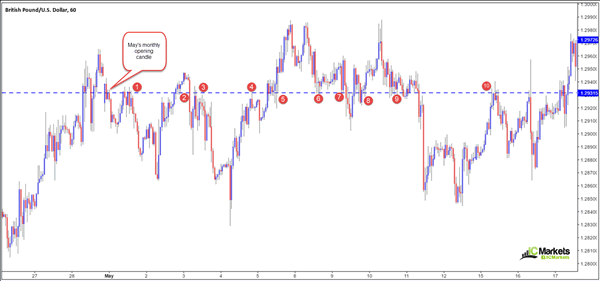
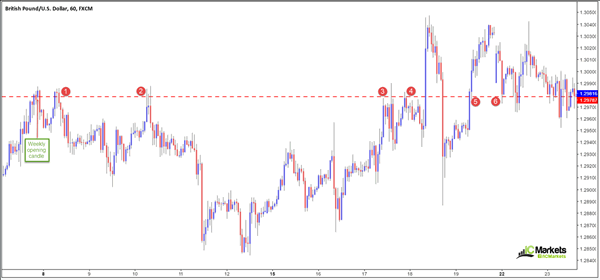
Each level, be it a weekly, monthly or yearly opening, held price reasonably well. Just look at May's monthly opening band, for example. For two week's this monthly level provided strong support and resistance.
Apart from seeing these levels bounce price, what do we believe actually causes a reaction to take shape? To our way of seeing things, this is due to unfilled orders. When the year, month and week comes to an end, a great deal of traders with deep pockets look to cover, alter and open new positions. As such, lots of 'order swapping' takes place, and with it, unfilled orders are often left behind. What we mean by an 'unfilled order' is simply an order that was left unfilled, i.e. not triggered, around a certain price point.
Say that you were a 'big fish' in the forex world who wanted to add to your position going into the month's close, as the instrument being traded was showing signs of strength. Now, big fish do not trade like little fish. We retail traders can place orders and generally receive no slippage. However, when you are trading several hundred lots, one cannot just slam dunk that order into the market, as slippage could place you in a very awkward position, far away from your entry point. So, bigger fish usually enter the market incrementally, and by doing so, do not always get their entire position filled. Therefore, big fish have the choice of leaving the order in place unfilled so as price can pick it up when/if the market returns. This, we believe, is what generates a reaction from these levels from an order flow perspective.
How does one use these opening points?Personally, we will never use an opening level, or any level for that matter, as a stand-alone tool. It always has to have additional confluence. We absolutely love points of confluence, and they do not get much better than a confluent yearly, monthly or weekly open level. Confluence, in trading, essentially means the combination of structures coming together to form a buy/sell zone.
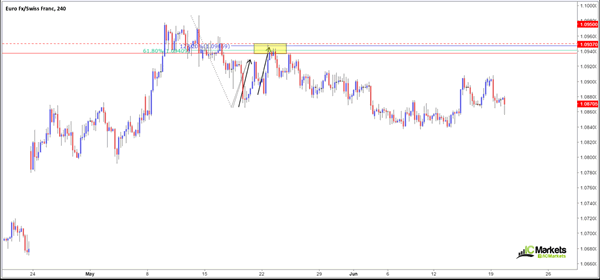
The chart above shows a setup our team would be very interested in. It boasts a great deal of confluence. The yellow sell zone is made up of the following structures:
A monthly open level at 1.0937 stretched all the way back from April 2016.
A H4 mid-level resistance at 1.0950.
A H4 AB=CD 127.2% ext. at 1.0946.
A H4 61.8% Fib resistance at 1.0940.
The noted structures help form a trading area. Trading using a zone also gives the trade room to breathe, and a place to position a stop-loss order.
