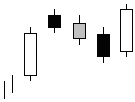
It is the confirmation or denial of a trend that determines whether an investor will sit tight today and hold his or her position or decide to enter or exit an issue that could be long or short the market. Candlestick charting allows investors to focus on continuation patterns and use them to confirm or deny trends that the chartist can learn to recognize. Here, we look at candlestick charting as an art, and put aspiring investors on the path to honing their craft.
Patterns on the Bullish and Bearish SidesIn the world of Japanese candlesticks, there are a number of bullish and bearish continuation patterns. With a short list on the bullish side of the market, a chartist would look for the following patterns:
1. Mat Hold
2. Rising Three Methods
3. Separating Three Lines
4. Side-by-Side White Lines
5. Upside Gap Three Methods
6. Upside Tasuki Gap
This article focuses on rising three methods, mat hold and separating three lines.
With a short list on the bearish side of the market, one would look for the following patterns:
1. Falling Three Methods
2. In-Neck
3. On-Neck
4. Separating Lines
5. Side-by-Side White Lines
6. Black Crows
In this article, we focus on falling three methods, separating lines and in-neck.
Illustrating the PatternsFor each continuation pattern shown below, we describe the pattern and break it down, allowing you to recognize the formation more easily in the future. Starting with the bulls, let's have a look at rising three methods.
Rising Three Methods
This pattern starts out with what is called a "long white day". Then, on the second, third and fourth trading sessions small real bodies appear - these small real bodies form from a fall-off in price, but they still stay within the price range of the long white day (day one in the pattern). The fifth and last day of the pattern shows another long white day.

This pattern is, in the world of Japanese candlestick charting, a very bullish chart. It shows an upward trend on day one with investors taking a few trading sessions to relax to prepare for the next rise in price that occurs on the fifth day. Even though the pattern shows us that the prices are falling for three straight days, a new low is not seen and the bulls prepare for the next leg up.
Bullish Mat Hold
This pattern begins with a long white day and then, on the second day of trading, the issue gaps up and is a black day. What we see next in this pattern is somewhat similar to the previous pattern.

The second, third, and fourth days see the issue falling off slightly but not trading outside the range of the long white day on day one. Finally, the last day in the pattern is another long white day that closes above the close of the first long white day.
Separating Lines (Bullish)
In the pattern of bullish separating lines, you can see that the first day is a black day and the next day is a white day. The key to the second day is that the issue has the same opening price as day one.

In a bullish market, this pattern is simply viewed as a continuation of the trend because the second day starts off from where day one left off and continues the trading session to close higher still.
Now, on the bearish side of the equation, let's have a look at what the bears are looking for, starting with separating lines.
Separating Lines (Bearish)
You can see immediately that the bearish separating lines pattern is the exact opposite of the bullish separating lines pattern, so it does not need any further explanation.

Falling Three Methods (Bearish)
The pattern known as bearish falling three methods confuse many chartists at first. It is not until the third or fourth day of the pattern that it becomes clear.

Look closely and you can see that a new high is not formed from the high set on the first day. This is a very bearish signal and short sellers react strongly to this pattern.
In-Neck (Bearish)
The first day of the in-neck continuation pattern is a long black day and the second is a white day that shows an opening of trading below the low of the prior trading session. Then on the close, the price is equal to or just above the closing price of the prior session.

This pattern has the bears looking for the falling trend to continue but it may be some time before it is confirmed.
ConclusionLearning to read and recognize candlestick patterns is important for anyone who aspires to trade based on chart patterns. Perfecting this skill will take time and practice - mastering it will elevate it to the level of an art. Remember it's your money, so think, learn and invest it wisely.