As traders learn to institute indicators into their analysis, a constant theme will be forever present. Most indicators are based on past prices, and as such, will always lagging the market.
And an important lesson that almost all traders will inevitably learn is that past prices are not perfectly predictive of future price movements.
The Speculative Sentiment Index is a little different, and this is often considered one of the few ‘leading’ indicators available to traders in the FX market.
What is SSI?
The Speculative Sentiment Index, or SSI, is data derived from live traders with actual positions. The positioning statement, which is the most popular element of SSI, is a measure of the number of traders holding long positions in a currency pair to the number of traders holding short positions in the same pair.
Updates are issued intraday, and traders are provided with a number of statistics including positioning (ratio of traders holding long positions v/s traders holding short positions), open interest, and the daily change in long and short positions. The picture below will show a standard SSI update, as published by Quantitative Strategist David Rodriguez:
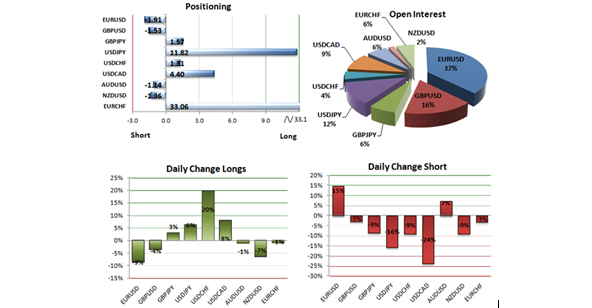
A Standard SSI Update Report, as issued by David Rodriguez, Quantitative Strategist, DailyFX
How to Use SSI PositioningThe positioning statement of the Speculative Sentiment Index is one of the more popular areas of the report, and this is where traders can observe the number of traders long in a pair against the number of traders short in a pair.
The bar graph below will highlight the positioning statement from the SSI update we had looked at above.

Speculative Sentiment Index Positioning Statement; EURUSD circled in Red
As you can see in the above graphic, EURUSD is showing a current reading of -1.91. This means that for every one trader holding a long position in the pair, there are 1.91 traders that are holding short positions.
Readings that are below zero indicate a net short position in the pair, while readings above zero indicate that traders are net long in the pair. So, for instance – in USDCAD above, with a reading of 4.40; this indicates that for every one trader holding a short position in USDCAD there are 4.4 that are holding long positions; a stark imbalance in the positioning of the pair.
SSI as a Contrarian (and Leading) IndicatorWhen new traders learn about the Speculative Sentiment Index, and learn to use it as a contrarian indicator, many will think of it as ‘fading the crowd,’ or going the opposite direction of retail traders.
If a trader can observe a net long position in the USDCAD, this can be seen as a sign that short positions may be optimal. But the reason for this isn’t necessarily because the 4.4 traders that are long in the pair for every one short are wrong – but rather, think about what these traders will need to do at some point.
The 4.4 traders that are long in USDCAD, at some point, will need to close their trades. And to do this – they will need to sell. And, of course, the traders that are short in the pair will need to do the same, and to close their short positions, they will need to buy.
So – at some point in the future, we can see 4.4 units of supply coming into the market, for which there may be only 1 unit of demand (from short positions buying to close).
This can create more selling pressure than buying pressure, and traders looking to take advantage of this selling pressure can look to open short positions with the indicator.
How to Use SSIThe Speculative Sentiment Index can be a powerful tool; but just because it is one of the few leading indicators available to FX traders, it doesn’t mean that it’s perfectly predictive. Traders should still look to utilize strong risk management in their trades, even with the assistance of SSI.
For traders that want to institute SSI in their trading, it may be advisable to first locate strong trends, and then to filter with the SSI indicator.
For instance, in the USDCAD example above, SSI was at 4.40 – which would be bearish considering that more selling pressure may be in the future of USDCAD than buying pressure. When we pull up the current chart on USDCAD, we see that the pair is mired in an extended down-trend from this 4-hour chart:
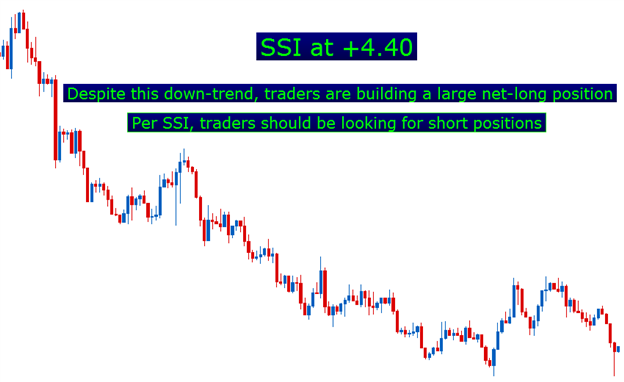
If traders observe a reading such as +4.40 in USDCAD while the pair is mired in a long-term down-trend, this can be seen as an opportunity to go short.
Traders can look to initiate the short positions in a variety of fashions. Some traders may prefer to wait for price to move up to an intra-day resistance levels, while others may prefer to wait for an RSI trigger on a shorter time frame.
Traders should also look for the larger imbalances in the indicator. A good rule of thumb is to look for readings of greater than +2 or less than -2 in which the trend agrees with the contrarian element of the indicator.
