In the articles above I have introduced the candlestick chart and motivated why it is one of the most used type of charts. I have explained how candlesticks are formed and which are the most important and frequently used patterns as well a strategy on how to use this type of patterns at key levels.
Let us talk a little about Moving Averages before getting to discuss about the trading strategy. A widely used indicator in technical analysis that helps smooth out price action by filtering out the “noise” from random price fluctuations. A moving average (noted MA) it is a trend following indicator, or also known as lagging indicator. It is one of the most known and used indicator among technical analysts and not only.
There are many types of moving averages, but the most used are the simple moving average (SMA), which is actually the simple average of a security price (which could be open/high/low/close) over a defined number of time periods, and the exponential moving average (EMA), which gives bigger weight to more recent prices. The most common applications of MAs are to identify the trend direction and to determine support and resistance levels. While MAs are useful enough on their own, they also form the basis for other indicators such as the Moving Average Convergence Divergence (MACD).
Now that all the terms are clear let us talk a little bit about the trading strategy. The system is based on a moving average (it doesn’t matter if it is SMA, EMA, WEMA, etc) which proved that acts like a very good mobile support and resistance. I could suggest here to try combinations around these number of periods: 7, 21, 30, 50, 100, and 200.
Once you have found a moving average that works best on a certain instrument (all instruments require fine tuning for Mas, meaning that a 200 EMA will not work as well on EURUSD and NZDUSD), you will just have to hunt for candlestick patterns which emerge around the moving average.
Let us take the following examples:
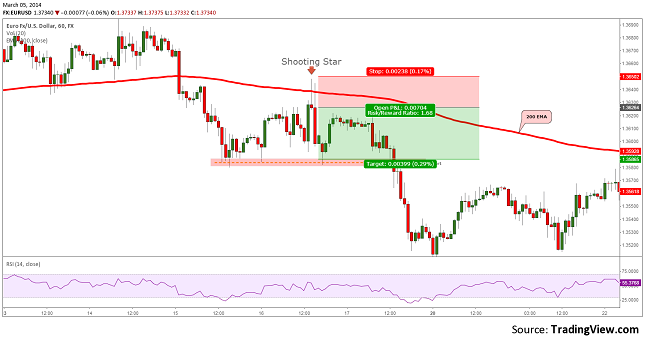
1. In the first example I have put a 200 periods EMA on the 60 minutes chart of the EUR/USD. The price has clearly broke the EMA and dropped to 1.3585. Here the demand grew for the Euro and pushed the price back to the EMA where we can see that a Shooting Star has been drawn. This is usually an important signal. Taking into consideration this setup a Short positions should have been taken at the opening of the next candle. The Stop Loss should have been set above the Candlestick Pattern and the Take Profit somewhere near the demand area. Of course with good position management the profit could have been even bigger.
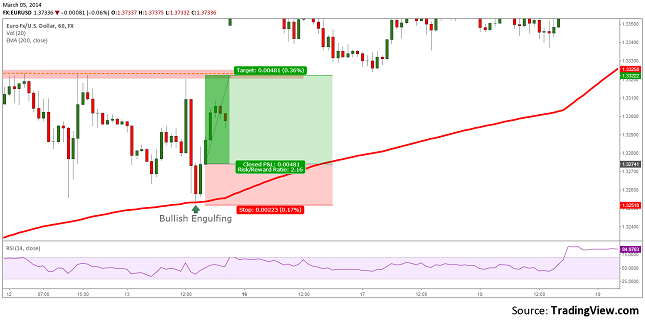
2. In the second example I have used the same 200 EMA but as for support. A Bullish Engulfing has emerged right at the mobile support. The entry should have been on the opening of the third candle (to assure the fact that we have a candlestick pattern). The Stop Loss should have been set under the pattern and EMA, while the Take Profit could have been set at the closest supply area.
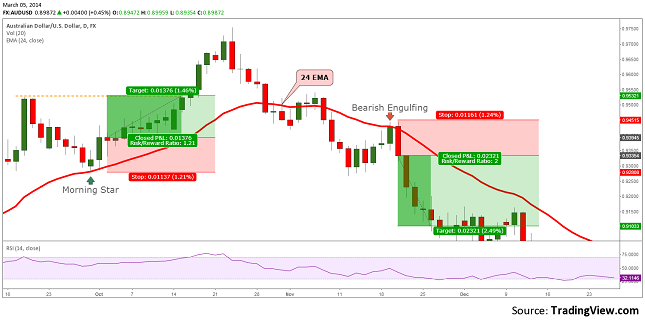
3. The third example is made on a 24 EMA of the closing price for the AUD/USD on a daily chart. After I have convinced myself that this is the proper moving average to use in this conditions I have started to look for candlestick pattern. As you can see on this chart I first encountered a Morning Star pattern which tested the EMA as a support. After a confirmed breakout under this moving average, a Bearish Engulfing signaled correctly a down move. Entries, Stops and Take Profits for the long trade example here are set like in the 1 and 2 examples, while for the short trade I have used a money management target, because I did not have any good support level.
 Friendly Recommendation
This is a very simple strategy that can be used quickly. I would though recommend to test it on demo accounts and practice intense for better understanding. The moving averages that you will use in your trading should be tuned to offer better results and the candlestick pattern should meet the theoretical characteristics for higher probability of success.
Do not forget to use money management along with this relatively simple trading strategy. Stop Losses are required for protecting your account in case of losing trades. Do not underestimate the market, even though the probability might be in favor of the trader when using this strategy, it might happen to catch a false signal and find yourself in a losing trade.
And do not forget to trade what you see and not what you think you see!
