1. IntroductionLast month for the article contest I published an article giving an introduction to the Ichimoku Kinko Hyo (Ichimoku) indicator, it was a beginner’s introduction as I am a beginner with the Ichimoku. Since then I have had some time to experiment with the Ichimoku learning what does and does not work when using it to place trades.
This article will better explain the components of the Ichimoku and offer insight into how to identify and place trades accurately and safely. Keep in mind that some parts may be reiterated from my previous article.
2. Teachings of the Ichimoku
2.1 Teachings of the Tenkan-Sen The Tenkan-Sen referred to as the conversion line, is calculated using the midpoint of the highest high and the lowest low over 9 periods.
Figure 1. Ichimoku, Tenkan-Sen on NZD/JPY 1 Day Chart
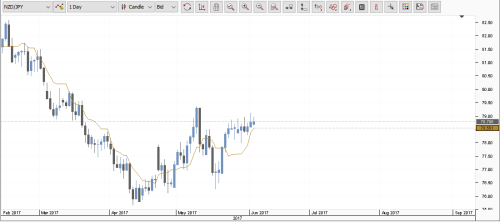
In Figure 1 I have removed all lines except for the Tenkan-Sen. On its own the Tenkan-Sen can show momentum, we can see it steeply curving upwards on NZD/JPY which shows significant bullish momentum, if the momentum was bearish it would curve downwards and if there was indecision in the market it would become flat.
2.2. Teachings of the Kijun-SenThe Kijun-Sen referred to as the base line, is similar to the Tenkan-Sen, but is calculated using the midpoint between 26 periods as opposed to 9.
Figure 2. Ichimoku, Kijun-Sen on NZD/JPY 1 Day Chart
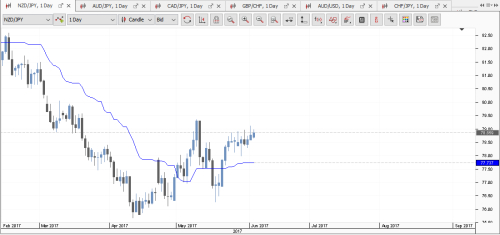
In Figure 2 I have removed all lines except for the Kijun-Sen. The Kijun-Sen on its own indicates momentum on a more medium term, in this case it is flat indicating indecision, but previously was steeply sloping down in line with a bearish trend. The Kijun-Sen can also be and is regularly used as a trailing stop loss.
2.3. Teachings of the CloudAs covered in my previous article the cloud is made up of two lines and is used to determine long term trend direction. The lines are:
2.3.1. Senkou Span AThe Senkou Span A line is calculated using the midpoint between the Tenkan-Sen and Kijun-Sen lines and then shifted right by 26 periods, so it is leading and forms the faster cloud boundary. When this line crosses below Senkou Span B this indicates a bearish trend and this is when the cloud will go red.
2.3.2. Senkou Span BThe Senkou Span B line is the midpoint of the 52-period high and the 52-period low, this line is also shifted right by 26 periods and forms the slower cloud boundary.
Figure 3. Ichimoku, Cloud on NZD/JPY 1 Day Chart
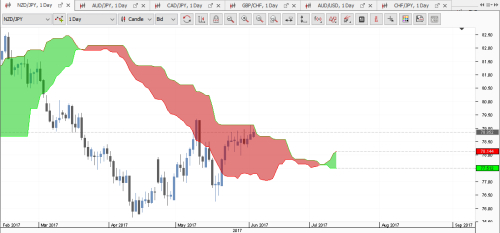
In Figure 3 I have removed all lines except the Cloud. On its own the Cloud indicates long term trend, most platforms will represent this by filling the Cloud with red for bearish and green for bullish. However, in this chart we can see the price passing through the Cloud and the Cloud beginning to turn green, if the price were to close above the cloud this would be a buy signal.
2.4. Teachings of the Chinkou SpanThe Chinkou Span or lagging span, is the current price shifted to the left by 26 periods, this is default but can be altered for different strategies and/or preferences.
Figure 4. Ichimoku, Chinkou Span on NZD/JPY 1 Day Chart
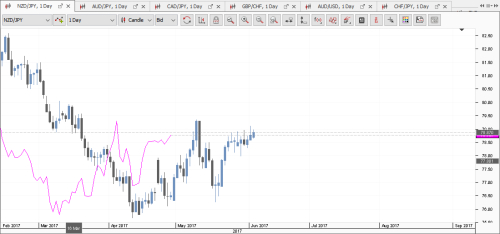
In Figure 4 I have removed all lines except the Chinkou Span. The Chinkou Span on its own can indicate momentum, in this case it is curving up and indicates bullish momentum. It can also be used as a buy signal when it crosses the price line.
3. Trade Signals of the Ichimoku
3.1. A price close above or below the cloud and Tenkan-Sen/Kijun-Sen linesFigure 5. Ichimoku on NZD/JPY 1 Day Chart
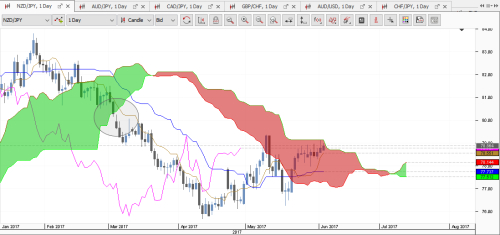
In Figure 5 I have circled a sell signal on the NZD/JPY daily chart. The Price closes below the cloud and Kijun-Sen/Tenkan-Sen lines and the Chinkou Span has crossed below the price line.
Figure 6. Ichimoku on NZD/JPY 1 Day Chart
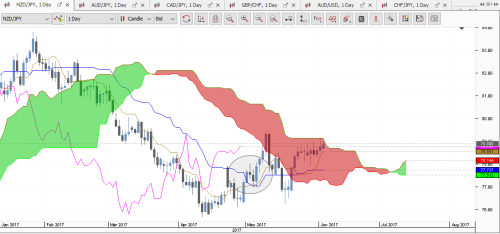
In Figure 6 I have circled where a trader would close this position. The price closes above the Kijun-Sen line, the Kijun-Sen being the trailing stop loss means this position is closed. With an entry around 80.212 and a close at around 77.713 this trade would have yielded a profit of 249.9 pips.
3.2. A close back below or above the Kijun-Sen line in line with trend Figure 7. Ichimoku on AUD/JPY 1 Day Chart
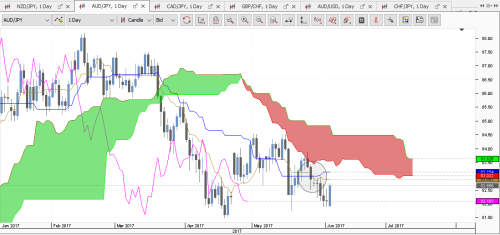
In Figure 7 I have circled a price close below the Kijun-Sen and Tenkan-Sen lines in a bearish trend as shown by the cloud, this is a trade signal and once the price is below the Kijun-Sen it becomes the trailing stop loss again. This is also a strong cross as the Tenkan-Sen crossed back below the Kijun-Sen in a bearish trend.
3.3. Weak Cross Figure 8. Ichimoku on CHF/JPY 1 Day Chart
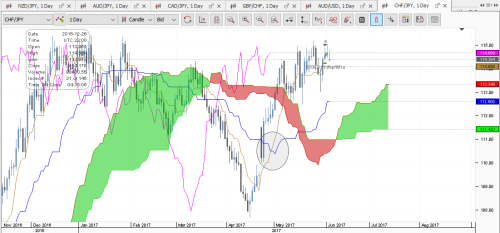
In Figure 8 the Tenkan-Sen crosses above the Kijun-Sen indicating a bullish trend change while the cloud is showing a bearish trend, this is a weak cross because the overall trend is bearish and it would be a safer trade to wait until the price breaks the cloud, however in this case it would have been successful to place the trade once the weak cross had happened, but the probability of a winning trade would have been lower. I personally do not trade weak crosses.
4. Conclusion The Ichimoku is an incredibly complex indicator comprised of 5 lines, two of which form a cloud when filled. After learning this indicator, a trader can gauge momentum, trend and identify trade signals with a single look.
In this article, I have covered how a trader can do this and specifically outlined some common trade signals seen with the Ichimoku.
Please be aware that the Ichimoku responds differently to different currency pairs and you may want to wait for extra candles to confirm trade signals on some pairs.
