1. Abstract:I left some possible entries by patterns on few currency pairs. And today's article I want to talk about of the results produced by these entries the last month. The original post you can find here: Post 4 August 2017
There are few who produced high results and other who produced loss, the review process was done assuming a simple money management in this case, was placing an order above or below of "D" point with a risk between 30 to 50 pips, a limit to the nearest zone or at the key levels using Fibonacci numbers, no move the stop loss till the next seven days or more.
At the end I will leave another few pairs with the same possibles entries to be analyzed the next week.
2. Development:The best is to follow the same process again, and again to improve results in the long time.
So, based on this goal. I will explain each of them with a picture to understand best what the price did after the signal.
The main goal is not to get a 100% correct pattern or signal, more like how good you can manage the trades and risk.
Below you can see the entries of the last post on 4/August/2017 and a summary of the final result at today.
SIGNAL TIME 29/JUL/17 00:00
X = price at that signal time
D = Competition of the signal or pattern.
Chart = Daily
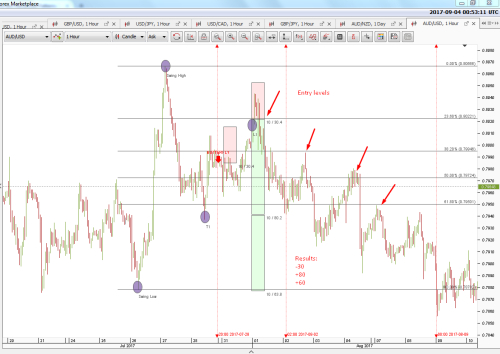
AUD/USD, BEARISH BUTTERFLY, D = 0.79856, X = 0.79856 [+110 pips]
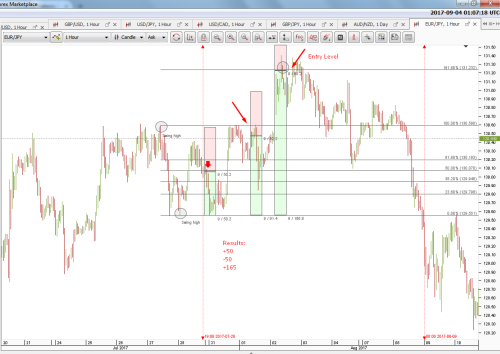
EUR/JPY, BEARISH GARTLEY, D = 130.1, X = 130.054 [+160 pips]
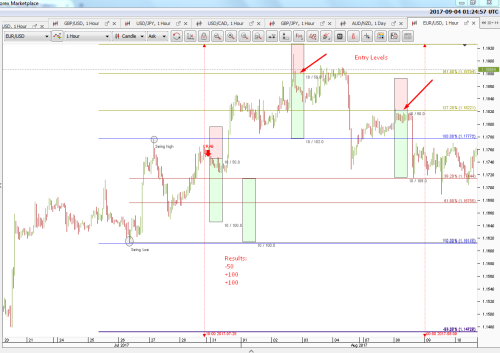
EUR/USD, BEARISH CRAB, D = 1.17485, X = 1.17485 [+250 pips]
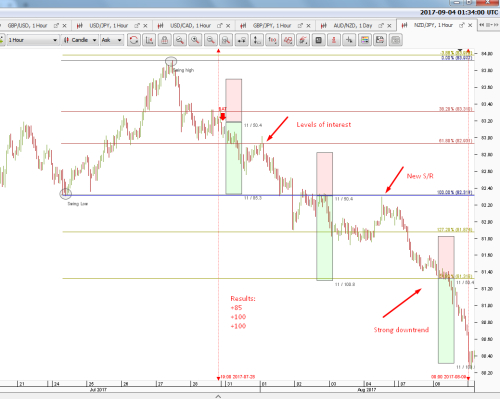
NZD/JPY, BEARISH BAT, D = 82.93, X = 83.199 [+285 pips]
USD/CAD, BULLISH SHARK, D = 1.2435, X = 1.2435 [+240 pips]
Total = + >1000 pips.
2.1 Pair: AUD/USDAs you can see, the signal of this pair was a loss of -30 pips, but based on the short signal if we did try to find another entry reason
This could be at a key level, in this case at 23% from the last swings (high / low).
By waiting each lower low and higher high, we could move the stop loss above each key level.
As a result of this we could have one accurate order and one loser.
 2.2 Pair: EUR/JPY
In this case, based on the short signal we maybe could be have two losses of 100 pips total, but based on the limit of
take profit at the nearest level in this case the swing low the first order was a win. The R&R=1:1
Using a extended move, knowing that the price did break up the measure of 61% as extension could be help to place
a short limit with the same risk of -50 pips. In this case was a win of +165.
Note the same process, measure, extend, wait for each lower low, higher high.
 2.3 Pair: EUR/USD
The EURO was in a strong uptrend, but the time from this analysis was a corrective leg down.
Based on the entry short signal, the first order was a loss of -50 pips.
Using the extensions of the last move, if we try it again at a key level as 161% this could produce a win of +100 pips.
The same concept taking the key level of 127%.
 2.4 Pair: NZD/JPY
This cross, based on the signal did give to us the best results because the price was an downtrend.
As you can see, the chances to move stops all the way long is clear.
Using levels of interest to add more at the current positions seems to be good idea.
Even to trail it by each hourly swing.
Note the same process taking the last swing high / low to measure key levels and extended moves.
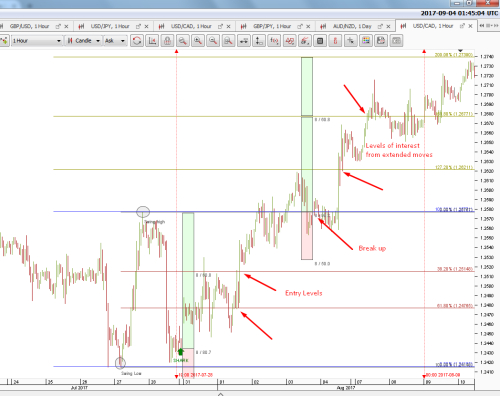
 2.5 Pair: USD/CAD
The DOLLAR was in a strong downtrend, but based on the signal who give to me a long entry.
By risking -50 pips, we can achieve even +200 pips in two weeks.
To jump in to the market at break outs is a good idea too.
Note the same process, and key levels as the others pairs above.
 3. Conclusions:
After a loss a new opportunity could be there, that is because loss signals and after that did a double top or bottom and then jump.
To use the same process give to us better results in the long term.
To wait for each swing ( high / low ) is best to take new decisions, that is to entry, move stops or even trail it.
4. New signals:SIGNAL TIME 4/AUGUST/17 00:00 GTM/UTC
X = price at that signal time
D = Competition of the signal or pattern.
Chart = Daily
EUR/NZD, BULLISH BUTTERFLY, D = 1.666, X = 1.66
GBP/NZD, BEARISH BUTTERFLY, D = 1.81, X = 1.807
GBP/AUD, BULLISH GARTLEY, D = 1.616, X = 1.628
NZD/CAD, BULLISH BUTTERFLY, D = 0.888, X = 0.888
CAD/JPY, BEARISH BAT, D = 89.1, X = 88.7
