My understanding on fundamental analysis is that a review on real economic activities or events which are affecting foreign currencies exchange strong or weakness that is refleceted in the forex spot market. Some factors that affects a country currecy exchange rate in corresponding to forex fundamental analysis comprises of country inflation, interest rate, current account, public debt, terms of trade, political stability, economic growth, and so on. Meanwhile, forex technical analysis is basically a review on the currency market movement up and down on chart tool based as a utility to identify market direction, level, and momentum. Perfectly, we should look at both analysis together so that we can grab all aspects of the market in one basket. The advantage of the fundamental analysis will give us the market’s insights of current economic information and technical analysis will give us clues to the probability movement based on chart historical data. While we are trading by using charts as tool then technical analysis knowledge and skill will much help us for example to find the best momentum, entry location, exit target, and determine position size.
To make it easier to understand, I will give an example from recent fundamental analysis contest item i.e. CAD Retail Sales which was occurred on 23 Maret 2018, as follows;
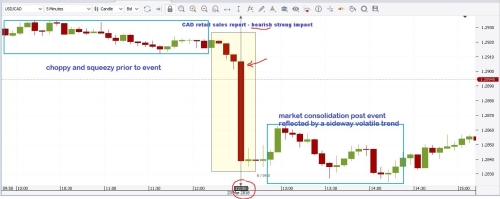
Retail Sales report is a monthly statistic information that presenting goods consumption that were sold by retailers excluding vehicles or automotives. During the last CAD (Canadian Dollar currency) Retail Sales report calendar event at 23 Maret 2018, I made a note that a positive growth from previous statistic data which was negative (- 0.8%) to become possitive (1.1%) prediction. That means it should be anticipated to be possitive impact to CAD currency in the short term within 10 to 20 minutes after statistic report minute of meeting released. That means USDCAD pair chart will reflect a BEARISH movement at the moment. And that finally met the prediction to be bearish move eventhough the index number was slightly slippage.
And now I would like to put a technical chart analysis on my recent fundamental analysis for USDCAD pair based on CAD Retail Sales report which was actually occurred at 23 March 2018 12.30 GMT. We can see in the chart below that there was a significant bearish move impact to the pair at that time. This is a good example how to connect between fundamental and technical analysis and how to figure out the economical event in real life in to the digital and artificial forex chart.
However in fact, there could be paradox phenomenon sometimes between fundamental and technical analysis which seems contrary during prediction of the market direction. Then there could be a sentimental factor in the market which is affected much by the complicated psychological conditions from all market players at the moment to be bullish, bearish, or stay sideline. A trader’s experience, skill set, and psychological maturity that will take important role in his trading to be better and better from time to time.
