Highlights:* Looking for a breakout in all the wrong the places
* Trading last year’s headlines today is comforting but ineffective
* Do not set it and forget, stay nimble and keep checking the market’s vital signs
As the sun rises on the second half of 2017, it is worthwhile, and hopefully profitable to look back at some of the biggest mistakes traders have made in the first half of the trading year. If the first half of 2017 did not bring the trading results you were looking for, you are not alone. Hopefully, a walk through the halls of the common mistakes traders made in 2017 can be used by you to change course for a better, more prosperous second half.
Would you like to know what our top minds are watching over the long-term in markets?If the first half of trading in 2017 was better than you envisioned, it is possible that those on the other side of your trade were making the very mistakes you’re about to read. It’s always good to know the enemy, and I hope you enjoy reading through the top three mistakes those on the losing side of your winning trade were making. It has been said that trading is a zero sum game and fading or reversing your oppositions mistakes is one of the quickest ways in markets to straighten your path.
We’ve analyzed the mistakes of the masses for over a decade. Click here to see what they are doing now.
Looking for a breakout in all the wrong the placesThe main frustration that many traders have voiced in our webinars is the lack of a Dollar rally. Given the Trump election that was supposed to reign in inflation and the hiking cycle from the Federal Reserve, many understandably believed that President Trump would make the USD great again (forgive me.)
However, this has not happened. Since the first week of trading, the Dollar Index has been on a near-straight path lower as other central banks like the Bank of Canada and the European Central Bank to name a few have begun hinting that their course to normalize monetary policy is just around the corner.
A key benefit of any economy is to know what has value and what does not. The market is the place to see where an increasing willingness to pay is a sign of things to come and a falling willingness to accept is a showman of the doubt. One place to do that is in options pricing. I make it a point in my DailyFX Closing Bell webinar to cover in highlights in options pricing over the coming week, month, or longer to see where there is a falling willingness to accept (showing bearishness in a market) or a rising willingness to pay (showing bullishness.)
While the pricing may not be easy to get your hands on, I use the Bloomberg Terminal in our office; a trader can look to Risk Reversals, also known as ‘Riskies,' to see if options traders are paying up to protect against a breakout. Before major events where volatility is forecasted and expected, you can see, which way the market is leaning and this can be very helpful information if the market begins to move in the direction that investors and institutions are paying to protect themselves against such exposure. Another tool that can be used is much easier to obtain, and that is looking at the Average True Range to see if volatility is expanding or declining.
10-Year Weekly Chart of the Dollar Index With Ebbing ATR Values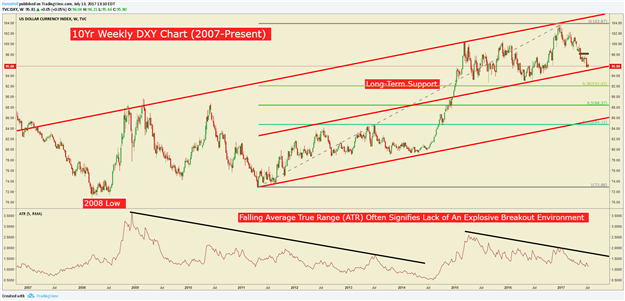
Because a price breakout or volatility can arise does not mean that it is a wise bet. The chart above is a 10Yr (2007-2017) of the Dollar Index that shows periods of consolidating Average True Ranges. An eventual breakout, as we saw in 2008 and 2014 can lead to great opportunities, but trying to guess when the breakout will occur with risk on the table can be a trader’s folly.
Trading Application: the mistake that I’ve seen too many traders make in H1 2017 was to trade and actively anticipate a breakout move that few if any investors or speculators are paying to protect. The benefit of falling or rising premium in the options market is that it shows a building consensus or credible fear that the market is about to move in that direction. I do my best to convey this information in my webinars as I find traders making the fallacy of expecting a breakout where few are in certain markets. The flipside to this is that while one market, like the US Dollar may not be moving as anticipated, traders can look for fault lines of a big move by studying other markets, and indeed, that is a way to keep a pace of what could be moving and worth trading in the coming days, weeks, or months.
To take the willingness to pay and willingness to accept concept a bit further, if the smartest players in a market in not pricing volatility in a certain market, why would you be willing to pay for it. Look for where they are pricing in volatility or trends, and look for opportunities that match your trading style there.
Trading last year’s headlines today is comforting but ineffective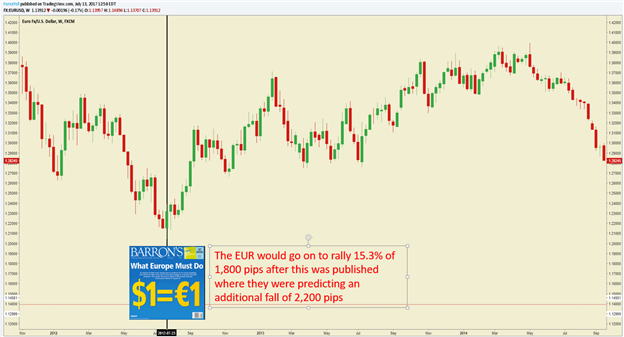
Make no mistake about it; most traders feel most confident about a trade when they are executing the order. Naturally, they have had to talk themselves into the trade and weight their forecasts against other views to see that this trade is the one that will hopefully put a few more zeros or shift the decimal place in their account equity to the right. However, one easy mistake to make that traders easily fall prey to is justifying a trade that should ideally pay out tomorrow on yesterday’s or last year’s headlines.
Believe it or not, there is a formal name given to this fallacy by the first psychologist to win the Nobel Prize in economics in 2002, Daniel Kahneman. The name of the fallacy is recency bias. Recency bias is the act of inferring that what happened yesterday will be what happens tomorrow. In H1 2017, this was seen most clearly with the bearish EUR/USD sentiment that was prevalent. The thinking went that because the market was convinced (and wrong) that EUR/USD would soon trade to parity at 1.000 (similar to 2012 as shown above, but closer to parity in 2017), that it was just a matter of time. Investment Banks and hedge fund managers began again to jump on the EUR/USD parity train only to see the train take them awfully close to 2016 highs at the end of H1 2017.
The change in sentiment for EUR/USD can be seen clearly from a change in Q4 2017 and 2018 EUR/USD forecast by Deutsche Bank (DB) that was revised on Monday, July 10. DB shifted their Q4 17 EUR/USD forecast from 1.02 to 1.17 and their 2018 forecast from 0.95 (below parity) to 1.20. Their 2018 forecast has shifted 2,500 pips! Well, at least they changed. Either way, it’s helpful to know that what happens tomorrow will not be determined by what happened yesterday.
When studying for the third level of Chartered Market Technician, I came across this quote that has stayed with me and will continue to stay with me from founder and chief strategist at GMO, Jeremy Grantham. It is also worth noting that this quote was published in March 2009. The SP500 Index has since rallied 268% at a ~17% annual clip from that month that this quote was published in the monthly letter.
“The market does not turn when it sees light at the end of the tunnel. It turns when all looks black, but just a subtle shade less black than the day before.”
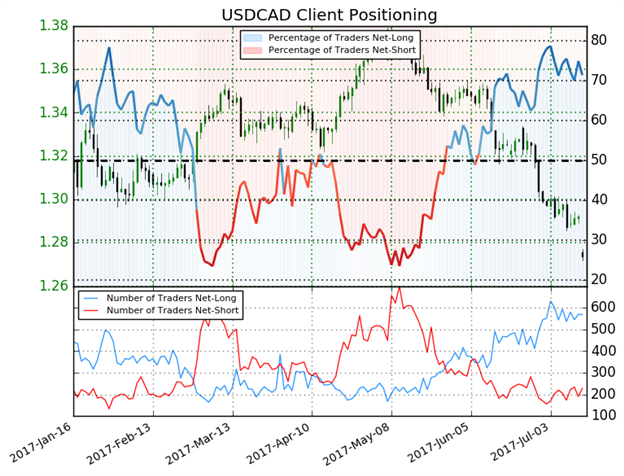
Here is a more recent example, though the EUR/USD example at the beginning of this section has become trader lore for those who appreciate sentiment extremes. USD/CAD has recently staged an incredible turnaround, but when looking at client positioning via IG Client Sentiment (IGCS), you can see a strong fight via increased long positions in USD/CAD as short positions (the right position to capture the downside) reduced dramatically. This is a near real-time example of traders trading today, yesterday’s headline.
Trading Application: Trading well has a lot to do with successful anticipation based on developing themes. Obviously, markets are a world where people agree on a price, but disagree on value. Either trader on one side of the trade in a speculative venture thinks the other a fool that they’re happy and hoping to take money from. When building a trading hypothesis whether the trade is short-term or long, it is best to look forward and reason backward. Practically speaking, you should have an idea of how the market should play out if your trade is to work and look for signposts that the market is confirming, albeit imperfectly, what you envisioned.
Using the example from the Mistake #1, there were many signposts that the EUR would soon be turning higher. I covered these when my DailyFX Closing Bell webinar began in April. The trick and skill are that a trader has to keep an open mind when the chips are on the table. This is not easy, but crucially important.
Recommended Reading: Bullish EUR/USD on Positive Bund Yield Correlation As European Political Risk Wanes
Do not ‘set it and forgetit,' stay nimble and keep checking the market’s vital signs to manage tradesThere is a lot to like about trend following. When the environment is ripe, it can pay off big with a relatively small workload. If you have read the work on the ‘Turtle Traders,’ you will likely be sucked into the beauty of staying a trade with just a trailing stop for months or years on end. Unless if you’re trading/ investing in equities that have been supported not by increasing margins, but by central banks, trend following in the traditional sense has not been a comfortable ride.
Weekly SPX Chart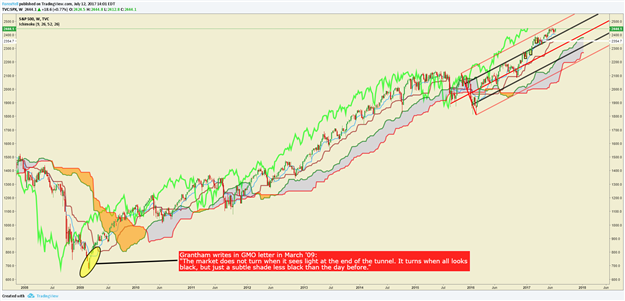
Here is another chart of the SG Index that shows the aggregate net daily rate of returns of 10 of the largest open Commodity Trading Advisors (CTAs) since 2014 put up against the SPX500. As mentioned earlier, the SPX500 has returned ~17% annually. The returns for the SG Index have gone into a bear market, falling 20%, but they also charge management fees on top.
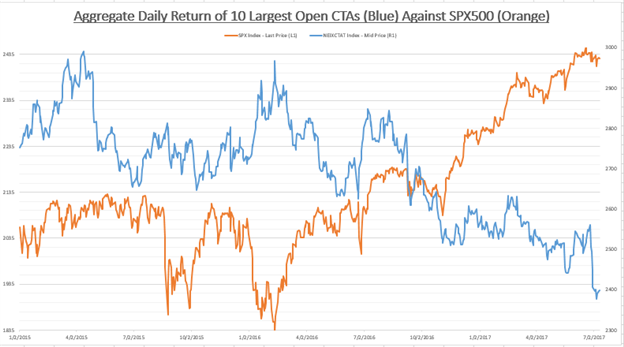
The point of this section is not to say that managed money often adds nothing but costs to a traders portfolio, Vanguard and other indexers do that for me, but to say that ‘set it and forget it’ style of trading has a time and a place and H1 2017 was not that time. It also appears H2 will not be an ideal time either.
In fact, looking at the chart of the SG Index when compared to SPX500, the CTA approach of set it and forget it has not worked well since 2015. It is worth noting that the trends that the CTA are often trying to catch the bottom of are unproven and they work tirelessly to get a ‘big call’ right so they can attract capital and assets under management. However, as you can see here, most bottom picking attempts do not play out as desired. The point of showing the SPX500 is that trends do exist, but exposure should be managed. If you saw the movie adapted from the book, The Big Short, the star fund led by Steve Eisman was privy to the trade due to a wrong number call by Greg Lippmann, Deutsche Bank bond salesman that gave them an investing lead to follow that ended in a $1 Billion+ pay day.
To see our updated Q3 2017 views, check out our popular Trading Guides by clicking here
The takeaway here is to stay nimble and do not think that you can beat the market by not paying attention to it at all. I don’t like to think of ‘beating the market,’ rather, I think of joining embryonic themes that are emerging and could lead to big payoffs if the correct moves are made through the decision tree forest of life and markets. Either way, manage your trades and track themes. To borrow an oft used phrase from Andrew Carnegie, “The way to become rich is to put all your eggs in one basket and then watch that basket.” This article is not desired to teach you to be rich, but rather to see when the basket that you have placed your eggs in is no longer capable of providing the risk-adjusted return you expected when you entered the trade.