GoalThe main goal of our investments will always to be at a higher profitability than the best possible risk-free option of investing. As we risk with our investments and have to involve our knowledge and time it is logical that we expect a better return than we get just for giving money to a financial institution. To assess our investment we could use various benchmarks, for example:
1. Best free of risk possibility - this is the final benchmark for any investment, we cannot go lower than that.
2. The average return on associated index (if we invest in shares).
3. The average return on stocks from the same market sector (for shares).
4. Average interest on government bonds across the world (for bonds, but could also be considered as a more ambitious alternative for free of risk investment bench). For forex, we can benchmark against best interest on governmental bonds available to reflect risk.
5. Average profit on assets with similar risk.
6. Fund/hedge fund based on the same assets. Best fund's result for the similar assets.
7. Best business opportunity to invest our capital that does not include financial instruments (if we run a company that invests its free cash in the financial market as a part of its activity or considers it). It is often wise to invest anyway if you run a company in order to diversify income, hedge against certain market conditions etc..
If our average profit is under the best free of risk option, we should just put the money into an asset like bank deposit and learn to trade better before investing in risky assets. That does not apply to a company hedging against market risk though, as an example. Return we want to achieve as an investor will usually be any profit above the average return on the assets of similar risk/volatility to justify the alternative cost of time and effort involved in our own investments, given that the average profit rate is above free of risk. For forex, we will likely take a profitable hedge fund with similar risk as our investments a benchmark. For stocks/bonds, the simplest benchmark would be same stock/bond average return on constant going long each time frame by the same amount of money (as it is tactics that do not need time/analysis).
Measuring risk of a financial instrumentRisk could be considered with negative or neutral approach. Negative approach considers risk as a possibility of failure whilst neutral approach tells that risk is both opportunity and danger. Neutral risk approach reflects market reality better (as more volatility = chance to earn more and to lose more). Simple and easy way to measure volatility and risk is standard deviation. Here is the formula:
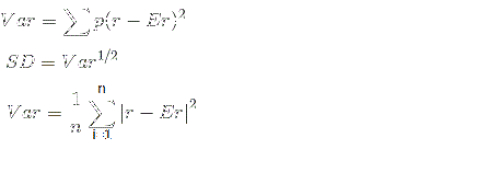
As we see standard deviation is a square root from variance. It shows by how many percentage points we should expect our final result to vary from the expected return. That way we can build the area of our expected profit. In standard Gaussian curve, over 2/3 of results are within 1 standard deviation while over 95% are in 2 deviations and 3 standard deviations cover almost the whole space of results possible (over 99.6%). Though man risky assets do not give anything close to perfect normal distribution, in almost every case our risk space will not exceed 3 standard deviations.
For stocks or CFDs we could sometimes simply sum the probabilities multiplied by the related deviations, remembering that probablility sums up to 1. For currency contracts variance I'd rather use the third formula where 'n' stands for historical time periods we take each single deviation from and then divide by total considered periods in the general time frame analysed. This is because finding probabilities for currency pairs after an exact time frame to be exactly at a certain level will usually be impossible.
It might not be obvious to everyone, but on forex assets you will need to multiply Standard deviation in a time frame you choose by the leverage you plan to use! Mere currency market moves will prove volatility lower than many stocks but multiplied by 20 or 100 makes a different story. This is also why many new traders get a margin call fast.What is also good in standard deviation is that we could include whole history of currency pair movements to find standard deviation for a smaller time frames we plan to invest in showing us some insight into where price might usually range in the chosen period. We should remember though that it is in standard market circumstances, not involving huge fundamental/political changes. Apart from this - SD is a nice measurement of where to put SL not to get shaken off by standard market voaltility in the chosen period.
In most cases for the same expected/wanted return a rational investor will choose an asset with a lower standard deviations unless investor has a high risk appetite. There are also ways to lower the risk and keep similar profit potential...
Hedging your risks - market correlationsCor (1&2)=Cov(1&2)/[SD(1)XSD(2)]
The simplest formula for correlation is the one above. Though it might look uncomplicated, counting Covariance (Cov) between asset 1 and 2 is long and tiresome, so we will usually just search for the data on the net or input numbers to excel or any similar program.
What we have to know is that correlation is always in space between (-1;1). The closer the value is to zero, the less dependent are the analyzed assets of each other. value of 1 or -1 mean that assets are dependent of each other ina way we can formulate as a linear funcion. No correlation (0) does not ensure that two assets are moving unrelated to each other - they might be connected by non-linear function. That means we always have to consider fundamental relations as an addition to maths.
The basic rule of diversification is to choose assets that correlate to each other in negative or only slightly positive territory. Graphically the difference in our risk/return looks like this:
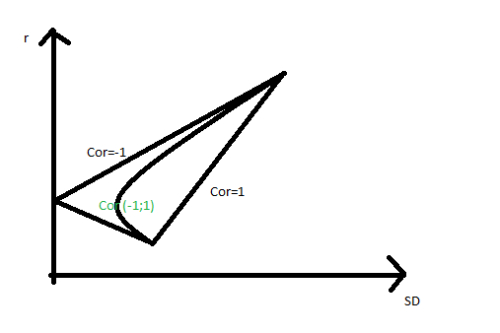
As we see, the best volatility/reward solution options would be given by assets correlating to each other by -1 (situation that does not happen in the market). Correlation of 1 (also impossible in the real market) gives no optimalization at all - we do not hedge by having 2 assets of that kind. Any pairs with the value of correlation between 1 and -1 (the real cases) will give a line inside the triangle. Values closer to -1 will cause stronger bend of the line towards a no risk point (SD=0).
The beauty of diversification lies in 2 facts:
1. You can get same profit while risking less.
2. It applies to every financial assets or even cross-markets assets (forex, stocks, bonds, options, hedging foreign stocks with forex contracts, hedging forex with options, hedging stocks with options etc.)
By using correlations you can construct a professional and risk resistant portfolio, resembling the way big institutions invest. For example on FX, look not only to choose different pairs but also count the right proportions and how are they related to each other in order to mitigate risks.
