Hello Friend,
I am delighted to be on Dukascopy Community and this is my first interaction with you all. Hope you will like my article.
As I am new to Forex market I thought to increase my knowledge about Forex market and its fundamental factors which moves Forex pairs. While doing research I come to know about some interesting facts about yield curve which I would like to share with you all. Knowledge is like tree which has multiple uses and brightens our thinking power. And you know in trading right decision at right time is very much important. So one must be ready to learn all the time throughout the journey of our life.
So friends, what is yield curve?
Yield Curve: Yield curve is a graph of interest rates of government bonds, against the maturity date at a set point of time. Yield curve is used as a benchmark for other debt such as mortgage rates or bank lending rates and it is also used to predict changes in economic output and growth. Yield curves help investors understand the relationship between bonds of differing time horizons to maturity. Understanding the yield curve is important to investors because easily comparing yields allows them to understand their return on investment and make investment decisions based upon these future payouts.
Why yield curve is important? Yield curve is important because it gives us idea about the future economic expansion or upcoming economic recession, rising interest rates or falling interest rates. It is gives idea about the countries economic health. Which is the most important factor for trader and investors to be familiar with it always.
What affects yield curve?To understand it in better way I will explain with example of US Federal Reserve. Bond prices and yields move in opposite direction. Short term interest rates and long term interest rates affects yield curve. For example, If Federal reserve going to raise interest rates in short term then front end yield rises while the expectation is that in longer term Fed is going to keep rates constant or cut the rates then back end yield curve tends to fall resulting in flatter yield curve. In general slower growth, low inflation and depressed risk appetites help the price performance of long-term bonds means yields tend to fall. Conversely, faster growth, higher inflation and elevated risk appetites hurt performance which causes yields to rise.
Now we will see types of yield curve and their respective meaning.
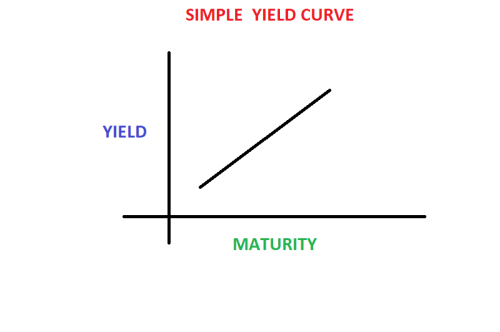
NORMAL OR UP SLOPED YIELD CURVE
A normal or up-sloped yield curve indicates yields on longer-term bonds may continue to rise, responding to periods of economic expansion. Looks like graph in an image I have shown above.
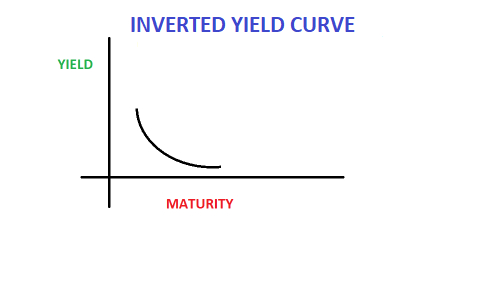
 INVERTED YIELD CURVE
Inverted yield curve gets formed when yields on longer term bonds continues to fall and yields on short term bonds continues to rise. It suggests upcoming recession in economy.An inverted yield curve is an interest rate environment in which long-term debt instruments have a lower yield than short-term debt instruments of the same credit quality. This type of yield curve is the rarest of the three main curve types and is considered to be a predictor of economic recession.
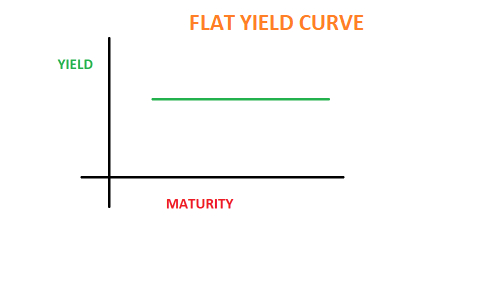
 FLAT YIELD CURVE
When the economy turns into transition from expansion to slower development and even recession, yields on longer-maturity bonds tend to fall and yields on shorter-term securities likely rise, inverting a normal yield curve into a flat yield curve. When the economy is transitioning from recession to recovery and potentially expansion, yields on longer-maturity bonds rises and yields on shorter-maturity securities starts falling, tilting an inverted yield curve toward a flat yield curve.A flat yield curve may arise from normal or inverted yield curve, depending on changing economic conditions.
After getting familiar with theoretical part lets have a look into practical knowledge where we will use this basics into real term examples.
As I have visited US treasury government website they provide daily graph of yield curve there we can compare with previous dates also whether yield is rising or falling compared to earlier dates. I have noticed that US treasury yield curve is inverted means at the moment US economy is in expansion.
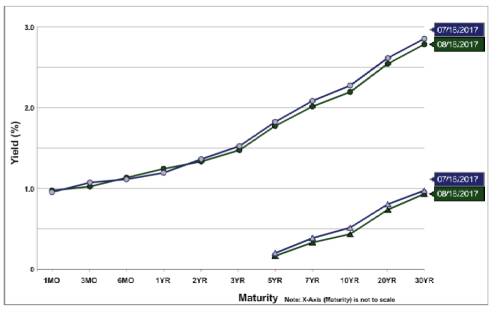
As in the image shown above I have compared yield curve with two dates that is July 18 2017 and August 18 2017. One can notice that yield in on July 18 2017 is more than the yield on August 18 2017. Now compare this with US dollar rates. We will get the correlation.
How we can use this yield curve to help our daily trading. Many sites provides yield curve of various countries where we can check whether yield is falling or rising. In short term if yield is rising then market participants expects Central Bank may raise interest rates in short term so currency gets strong in the short term. So it will help us in deciding about trades.
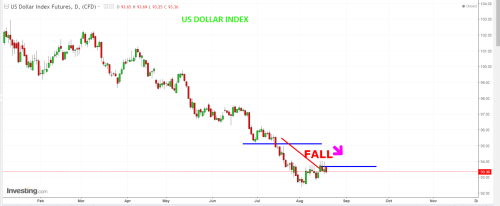
Now compare two images one of US treasury governments yield curve and second of US Dollar index chart we will get correlation between yield curve fall and Dollar Index fall. Above is the chart of US Dollar index I have marked two dates of July 18 2017 and August 18 2017 and we can notice fall between these two dates.
As in day trading we can check daily yield curve whether it is falling or rising and we can use this additional knowledge with other technical and fundamental factors to support our decision.
In Forex market one cannot rely purely on technical indicators as Currency pairs are data dependent so I have started with learning all the fundamental factors which affect price movement. I have read the book Market Wizard and found many interesting things how these successful traders got successful. I also want to gather as much knowledge as possible to become successful at earliest. This is my first attempt and I believe there are many stairs yet to climb in the trading career and this is just the beginning.
So dear friends share your experience and knowledge in the comment below. I am hopeful that you all friends will support me and share your experience.
Thanking You all.
