When Price Channels (sometimes referred to as Donchian Channels) are placed on a chart, they identify the high and the low price at which the pair traded over a specified period of time. The Channels on the Daily chart below are set to 20 periods so they would represent the high and the low at which the pair traded over the previous 20 days.
As such, they can be used quite effectively to visually identify levels of Support and Resistance on a chart. The channels can be used by “breakout” traders to identify entry levels. This would occur when price “breaks” below support in a downtrend or above resistance in an uptrend.
When the breakout occurs, this can be taken as an entry signal as the potential exists for price to continue to move in that direction for a period of time.
Let’s take a look at the example below of Price Channels on a Daily chart…
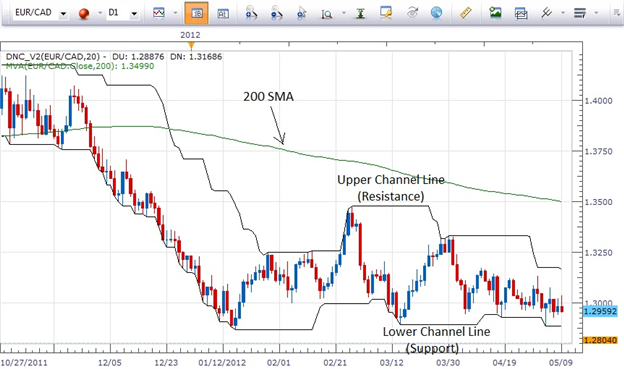
As noted on the chart, the lower channel line represents support while the upper channel line represents resistance.
As with most every strategy, the first step is to determine the direction that we should trade the pair. In the case of the EURCAD pair we know we want to look for opportunities to short the pair for the following reasons: 1) Price Action is below the 200 SMA and is pulling away from it; 2) at the time of this writing the EUR is weaker than the CAD, and 3) price has been making successively lower highs on this Daily chart since the end of February.
Now that we have determined the direction to trade the pair, we can look to a lower time frame chart to “fine tune” our entry. For our purposes on this pair, I prefer the 1 hour chart as we may be close to an entry.
When moving down to an intra-day chart (anything below a Daily) we will change the indicator to 55 periods. We do this to slow down the indicator a bit as we have moved to a faster, lower time frame chart.
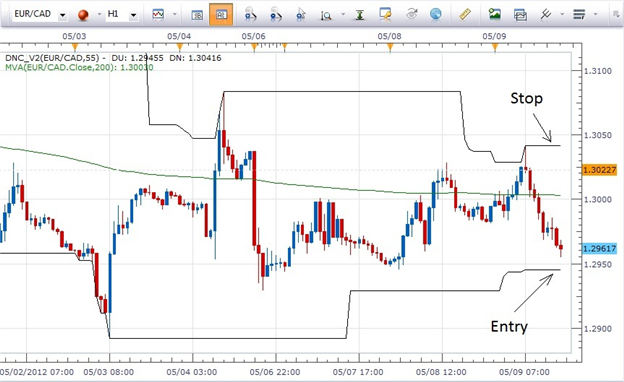
If/when price breaks below the lower channel line at 1.2941 a trader could sell the pair. The stop would be placed above the upper channel line at 1.3041. As can be seen, the price channels have provided us with our “breakout” entry along with our stop placement.
To manage the trade as it progresses, a trader would manually trail the stop by keeping it just above the upper channel line. The trade would be closed when price action retraces to the point that it intersects the upper channel line and the stop.
